The purpose of this paper is to analyze the current implementation status of renewable energy projects, analyzing not only the five country leaders during the last decade, in terms of their installed capacity, but also a set of emerging countries playing an important role at regional levels (the who of energy transitions), the sources of green energy that they have chosen (how the transitions are being done), and the trends in greenhouse gas reduction that they have achieved (how far the transitions have progressed).
Calculations based on various statistical sources—mainly the International Renewable Energy Agency (IRENA)—show that, while renewable energy installed capacity and implementation of renewable energy (RE) projects have grown in China, they have decreased to differing extents during the last ten years in the four other countries among the top five leaders in renewables (the US, Brazil, Germany and Canada). On the other hand, some non-industrialized countries have emerged in the regional renewable energy scene, and although they still do not stand out globally, they do play a significant role. In fact, in terms of transition toward a renewable energy matrix, the data shows that industrialized/high-GDP countries have made less progress at the national level than emerging ones. Regarding CO2 emissions, there are contrasting trends among the latter set of countries; however, the data analysis also shows that although economic growth negatively affects the decrease of CO2 emissions, individual energy consumption patterns might have an even greater positive impact in reducing emissions; current data from the US, China, Iran and the United Arab Emirates are good examples.
Keywords
renewable energy
emerging renewable energy countries
energy matrix transition
energy installed capacity
CO emissions
Author information
Introduction
The rise of renewable energy (RE) projects at the national level with the main objective of replacing the increasingly scarce, and therefore more expensive fossil fuels [1–3], has also yielded as a positive side effect; the possibility of reducing greenhouse gases, which has become an urgent need. Although the implementation of RE projects, both in stimulus policies and in actions, has been slower than expected, the global picture has shown important and overall rapid changes over the most recent decade.
One of these changes, which pertains to the conceptual and technical definition realms, has been the increasingly precise definition of the existing types of RE.
Among the seven best-known sources (hydro, solar, wind, marine, geothermal, and bioenergy), the types and subtypes derived from them are being established more clearly (Table 1). And although the available statistical information systems do not yet offer data for each of these categories, the taxonomy offers the possibility of more precise analysis.
Hydro energy
(a) Renewable
(b) Pure pumped storage
Wind energy
(a) Onshore
(b) Offshore
Solar energy
(a) Solar photovoltaic
(b) Concentrated solar power
Bioenergy
(a) Biogas
Landfill gas
Sewage sludge gas
Other biogases from anaerobic fermentation
Biogases from thermal processes
(b) Solid biofuels
Wood fuel and energy crops
Wood waste, black liquor, straw, bagasse, rice husks, other vegetal and agricultural waste, animal waste, renewable municipal waste
Biomass pellets and briquettes and charcoal
(c) Liquid biofuels
Conventional and advanced bio-gasoline
Conventional and advanced biodiesel
Bio jet kerosene
Other liquid biofuels
Marine energy
Geothermal energy
Table 1
Renewable energy sources, types, and subtypes currently defined.
Since the techniques to obtain energy in each of these types and subtypes vary greatly; the economic costs also vary, as do the environmental and social impacts.
Another quite noticeable change in the last decade is that although the ranking of the five regions of the world by installed RE capacity has persistently shown Asia in the lead, followed by Europe, North America, South America and Eurasia. Asia is the only region that has shown, year after year, constant growth in terms of its global share: it has risen from 33% in 2011 to 39% in 2015 and 46% in 2020; in contrast, the other regions have shown a decrease, the most significant being that of Europe, which went from representing 27% of the global total in 2011 to 25% in 2015 and 22% in 2020 [4].1 Similar decreases, although more moderate, occurred in the other regions: North America went from 18% (2011) to 17% (2015) to 15% (2020), South America from 11% to 10% and then 8% and Eurasia from 5% to 5% and finally 4% in the same period.
A further change in the current RE landscape during the same period relates not only to the countries that have committed to implementing RE (the who of the energy transition) but also to the types of REs for which they have opted (how the transition is being implemented) and the results achieved in terms of greenhouse gas emissions (how far the transition has advanced). Therefore, the first section of this paper offers an analysis of the top five countries with the highest RE installed capacity over the last decade. The second section provides a similar analysis, this time focused on emerging countries that are carrying out large national RE projects; although they still do not stand out at the global level, they do so at the regional level, seeking to contribute significantly to the energy transition. Then, a brief analysis of the evolution in the CO2 emissions in these countries is presented, followed by the main conclusions.
The top five countries in terms of RE installed capacity countries and their energy sources
In addition to the supremacy that Asia as a region has achieved in terms of installed capacity in RE, Asian countries have recently crept into the top five with the highest RE installed capacity in the world. This case of China, which in 2011 was already in third place after the regions of Asia and Europe and since 2015 has ranked second globally. In terms of how other countries rank with respect to regions, the US, Brazil and Canada follow the South America region, each individually producing more megawatts than the Eurasia region overall. Table 2 supplements this information, with individual countries in bold.
Rank
2011
%
2015
%
2020
%
1
Asia
32.6
Asia
38.8
Asia
46.0
2
Europe
27.1
China
25.9
China
32.0
3
China
20.1
Europe
25.2
Europe
21.8
4
N America
18.2
N America
16.7
N America
15.1
5
S America
11.4
USA
10.6
USA
10.4
6
USA
11.0
S America
9.7
S America
8.3
7
Brazil
7.0
Brazil
6.1
Brazil
5.4
8
Canada
6.2
Germany
5.3
India
4.8
9
Eurasia
5.4
Canada
5.2
Germany
4.7
10
Germany
5.1
Eurasia
4.8
Eurasia
3.9
Table 2
Top ten regions/countries in global share (%) of renewable energy installed capacity (2020).
Since 2011, the countries that compete with entire regions in RE installed capacity have been practically the same five, except India, which recently entered this group. However, among them, only China has maintained a constant rate of growth in installed capacity, gaining 6% between 2011 and 2015 and 6% again between 2015 and 2020; in contrast, the US, Brazil and Canada lost global capacity share, with Canada having the largest decrease (of 1% until 2015 and 2% in 2020), which led it to be dropped from this group, allowing the entry of India. The data also show that as a component of the Asian share of global RE, the Chinese contribution has increased considerably year on year, from 62% in 2011 to 67% in 2015 and 70% in 2020, which clearly indicates China’s rather than Asia’s supremacy on this indicator.
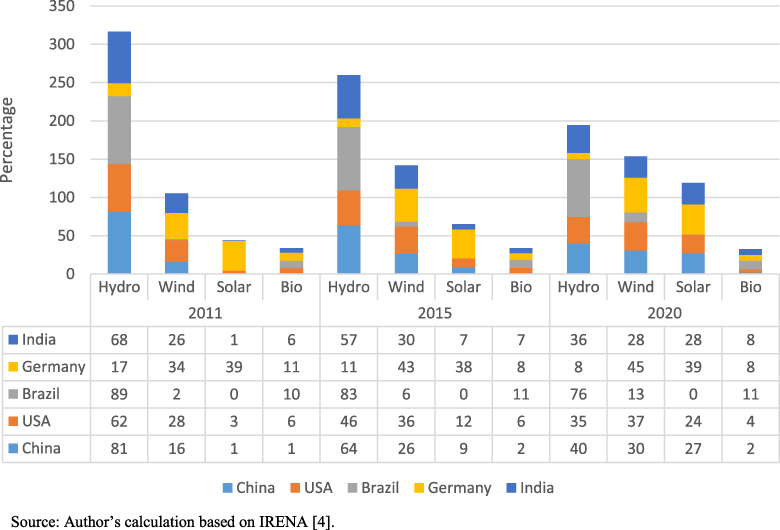
When the sources and types of RE that these countries have opted for are identified and analyzed, hydroelectric, wind and solar installations stand out from the remaining sources, with bioenergy just beginning to gain a place as the fourth most used source, though with significant differences in RE capacity shares when compared among renewable supply types (figure 1).
Figure 1.
Top five countries’ installed renewable energy capacity distribution by source (%—2011, 2015 and 2020).
China’s large proportion of hydropower in comparison to wind, solar and bioenergy is mainly due to the energy generated by the Three Gorges Dam, which, by the end of 2020, had generated a total of 111.8 billion kilowatt-hours (111.8 TWh), surpassing the previous world record of 103.098 TWh of electricity in 2016 of the Itaipu hydroelectric plant on the Brazil–Paraguay border.2
In China, as in the US, the percentage of hydropower has decreased during the decade, while those of wind and solar energy have grown, although not so significantly (figure 1). These trends are explained by the last century’s commitment to large dams, led in the US by the Hoover Dam (Nevada), with its 8.95 cubic miles of retained water, the Glen Canyon Dam (Arizona), and the Garrison Dam (North Dakota), among several others; this strategy eventually proved unattractive not only due to the evidence of the negative environmental and social impacts that large dams entail [10–13], but also to the advantages and innovations offered by solar technology [14, 15] and wind energy [16–18].
India, on the other hand, relies on wind as the second most common source of energy in its electricity grid and is currently the fourth-largest wind energy market in the world (figure 1); it also expects to add 20.2 GW between 2021 and 2025, which would imply growth of almost 50% over its current installed capacity of 38.5 GW [19]. Although the distribution of renewable sources of India and US and the installed capacity is relatively similar to that of China; India currently has the most equitable distribution among the top five of hydro, wind and solar sources, although there is still a slight lag on the latter.
Brazil, on the other hand, has chosen a very different path, focusing almost exclusively on hydropower. Brazil’s hydropower choice is reflected in the aforementioned Itaipu Dam, whose ownership and location is shared with Paraguay and commenced operations in 1984. Tucurui Dams, with a capacity of 8,370 MW—the first of which was also completed in 1984 and to which a second section was added, with construction completed in 2010. The Paulo Afonso Dam, with a capacity of 4,280 MW, built between 1948 and 1979, is also among several other large dams in Brazil. In fact, the Paulo Afonso Dam was not only the first great dam in Brazil, but—like the Hoover Dam in the US—it was the one that started the great wave of Brazilian dam construction that continues today.
Regarding its renewable energy sources, Germany opted for the opposite path to Brazil’s, as its natural water resources are far less abundant, but today, its industry and technological advances in solar and wind power are recognized globally.
Figure 1 also shows that the proportion of hydropower in total China’s RE has decreased over the years, while the shares of energy generated by wind and solar installations have grown significantly; more recent significant changes in the other four countries can be observed, as well.
If the Three Gorges Dam is the largest hydropower generator in the world, its counterpart in wind generation is the Gansú Wind Farm, whose construction began in 2009 and set a goal of 20,000 MW by 2020; a report stated that “in just five years, China leapfrogged the rest of the world in wind energy production, going from 2,599 MW of capacity in 2006 to 62,733 MW at the end of 2011” [20] and almost five times that amount in 2020, with 281,993 MW. Its growth in solar energy has been even more astonishing, with the initial value of 1% in 2011 rising to 9% in 2015 and 24% in 2020, thanks to, among other facilities, the Great Solar Wall, the third-largest solar plant in the world in 2020, located in the Tengger Desert, Ningxia Province, with a capacity of 1,547 MW and an approximate area of 1,200 km2. China was also ranked first in biomass generation in 2020, although to a much smaller proportion globally, with 18,687 MW of installed capacity from biomass, which represented 1% of its energy mix in 2011, 2% in 2015 and 2% in 2020. These figures together reveal China’s intention to achieve energy independence.
The US plans to install approximately 500 MW and power 5,000 homes with its Pecan Prairie Solar Project in Texas, in addition to the Golden Triangle Project in Mississippi, which will electrify more than 45,000 homes and produce 200 MW to be used throughout the region [21]. With regard to wind energy, the two US plants with the highest installed capacity are the Traverse Wind Energy Farm in Oklahoma, which plans to produce 999 MW to power 300,000 homes, and the Aviator Wind Project with 525 MW in Texas.
In 2011, both India and the US had significantly lower percentages of hydropower in their energy mixes than China, while their shares of wind and solar energy were higher. India is also far ahead of the US in installed solar capacity, as it ranks as the country with the largest installed capacity of this type, boasting four plants among the world’s top ten solar parks: Bhadla Solar Park (2,245 MW), Pavagada Solar Park (2,050 MW), Kurnool Ultra Mega Solar Park (1,000 MW) and NP Kunta Ultra Mega Solar Park (900 MW).
There is also a great lag in biomass energy capacity, although in India, and especially in its capital New Delhi, considered one of the most polluted cities in the world, due to both fossil fuel emissions and the burning of waste; promotion of bioenergy has become a matter of state. It was reported that in 2019, there were approximately 4.6 million small digesters based on cow manure and agricultural and human waste used for cooking and basic lighting [22]. In this context, highly decentralized waste management operated by individual recyclers and installation of large plants have been considered and in 2018, the government launched the initiative “Sustainable Alternative Towards Affordable Transportation” (SATAT). It promoted compressed biogas as an alternative transportation fuel, and Indian Oil Corp Ltd., backed by the government, was set to invite private companies between 2020 and 2021 to participate in the installation of 140 biogas plants [23]. However, “apart from the existing challenges of land acquisition, grid connection and permitting, the COVID-19 pandemic hit the market hard and caused delays in project construction execution” [24].
Brazilian hydropower shows a very high share in the country’s energy mix, but has decreased throughout the decade, although the decline has been moderate, and the compensation through increased installed wind and solar capacity has been very limited. The wind energy figures in Brazil are not significant, while those for solar energy were even lower: 0.002% in 2011, 0.03% in 2015 and 0.3% in 2020. Brazil’s commitment to hydropower is based on the fact that the country holds a fifth of the world’s water resources; accordingly, it ranks as the second-largest hydroelectric producer globally, after China. However, domestic consumption, which still does not guarantee total coverage of Brazil’s population, exceeds national production, so the country runs a series of diesel-operated plants and imports energy from Venezuela.
However, the almost nonexistent diversification of the country’s energy mix has left Brazil highly vulnerable to climatic variability and periods of drought; indeed, between July and August 2021, it suffered its worst drought in 91 years, unleashing an unprecedented water, agricultural and energy crisis. Even so, and despite the negative externalities from the construction and commissioning of large dams, Brazil’s hydropower commitment remains firm for the immediate future, with the announcement of four large new dams (Bem Querer with 650 MW, Tabajara with 430 MW, Castanheira with 140 MW and Telemaco Borba with 118 MW). However, there are also issues of controversy and resistance because Bem Querer and Tabajara are located in very environmentally sensitive areas (the former in the Amazon rainforest) and would impact large areas occupied by more than 25 indigenous communities and large fishing community populations [25]. It is surprising, to say the least, that a tropical country par excellence shows such little interest and insignificant progress in energy diversification through increased solar and wind installed capacity, in spite of large endowments of the necessary natural resources.
Bioenergy installed capacity is still very far from reaching the levels of solar or wind energy, but its current figures are still significant in the case of the total energy mixes produced in Brazil and India, albeit less so in Germany. In bioenergy installed capacity, Brazil follows China (15,650 MW), the US (12,332 MW), India (10,532 MW) and Germany (10,364 MW). There are currently 520 large biogas plants in Brazil with the capacity to produce approximately 2.2 million cubic meters per day of gas for electricity, thermal or biomethane generation, which is used as a substitute for liquefied petroleum gas or industrial fuel; in October 2020, Brazil inaugurated the world’s largest sugarcane biogas plant in Guariba, São Paulo state, with the capacity to generate 138,000 MWh per year, enough to supply 62,000 households [26].
Calculations of renewable sources of installed capacity for electrical energy distribution in Germany show that the share of wind energy increased by practically ten percentage points between 2011 and 2015, with production going from 22,712 MW to 44,580 MW, and continued to increase till 2020, reaching 62,184 MW; in fact, with the installation of 420 new turbines in 2020, there were a total of 29,608 onshore wind turbines by the end of that year, according to the German wind energy statistics agency [27]. Although Germany’s installed capacity of solar energy growth was lower, it was also significant and constant during this decade, rising from 25,916 MW in 2011 to 39,224 MW in 2015 and 53,783 MW in 2020. Note that this growth was due to domestic, not industrial consumption; in 2020, families acquired 88,000 solar energy storage systems, of a total of 272,000 installed at the end of the year nationwide [28]. The number of solar installations on the roofs of homes rose because the prices of this technology are dropping continuously, better subsidy conditions have been offered, and the popularity of electric vehicles is increasing daily.
As expected, solid waste management in Germany is very different from that in Brazil and India: solid waste comprises mainly agricultural waste, biogenic waste (food and other organic waste), solid biomass (mainly wood) and liquid biomass (rapeseed, soybean or palm oil). Transformation of this waste is carried out in biomethane plants through biogenic biofermentation for solid and liquid biomass, and the amount of energy generated has been increasing in absolute terms; in 2011, these resources accounted for 12,697 MW, in 2020, they provided 15,437 MW [29]. The corresponding share of installed capacity was 11% in 2011, 8% in 2015 and 8% in 2020.
However, although the technological evolution of solar and wind energy has been very well received and the global growth of solar and wind generation has proven its present and future value [30], these two sources of energy still face a major difficulty, namely, the “sporadic nature [of solar and wind endowments], which makes [these resources] somewhat unpredictable. Developing appropriate and large-scale storage systems is essential to increase the value of wind and sun-generated electricity” [1].
Nevertheless, International Energy Agency reported that “despite the pandemic, the growth rate in the world’s renewable energy capacity jumped 45% in 2020, part of ‘an unprecedented boom’ in wind and solar energy. It is the largest annual rate of increase since 1999” [31].
New players in the regional panorama of renewable energies
On September 22, 2020, Chinese president Xi Jinping announced in the United Nations General Assembly that China aims to achieve carbon neutrality before 2060 and to reach peak carbon emissions before 2030; this speech marked the first time that China’s leadership had made a commitment to reaching net zero emissions. The vice president for climate and economics at the World Resources Institute, Helen Mountford, stated: “President Xi sent an extremely important signal today with his unexpected announcement that China will strive for carbon neutrality before 2060 and strengthen its national climate commitment including peaking emissions before 2030. The devil will be in the details and China should set more specific near-term targets and an earlier peaking date, but China’s direction of travel toward a zero-carbon future is coming into focus. This announcement will send positive shockwaves through diplomatic circles and should prompt greater climate ambition from other major emitters” [32].
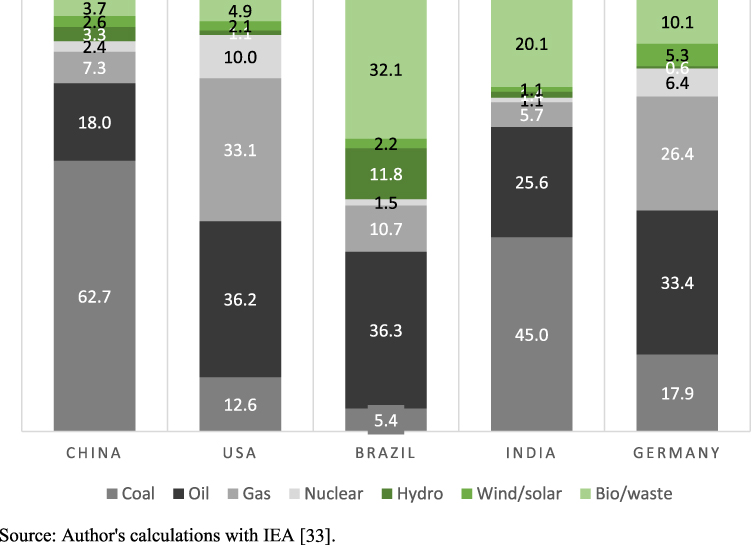
The devil is indeed in the detail, not only for China but also for all countries, because the production, distribution and consumption of energy involve multiple events that act as both cause and consequence of various phenomena in the many dimensions of modern societies. The figures for installed hydropower, wind and solar capacity for the top five countries in comparison to their electrical energy production from nonrenewable sources, results obtained are shown in figure 2 (Ref. [33]).
Within the current complete panorama (figure 2), RE still represents a small portion of the energy matrix, even among the countries with the largest RE installed capacity in the world: energy supply from fossil fuels still represents 92% of the total in the US and 91% in China. In this context, efforts to install and start up plants that provide energy from renewable sources are invaluable and urgent.
Among the top five renewable energy countries, despite the difficulties already mentioned, those who stand out for their reliance on renewables in their total energy matrix are Brazil, with 46.2% renewable vs. 56.8% nonrenewable energy supply, India with 22.6% vs. 77.4% and Germany with 15.9% vs. 84.1%.
Figure 2.
Supply of the top five renewable energy countries by source (%—2019).
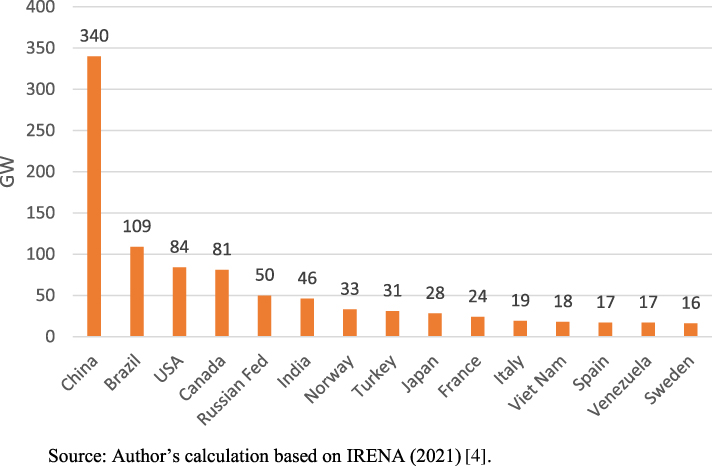
However, the devil is in the details with regard to the types of hydropower installed in some countries; the negative environmental effects of hydropower, added to other elements such as the size of the system and the way in which the water reaches the turbines, lead to the need to differentiate renewable hydropower from pure pumped hydropower. When “the water itself is not reduced or used up in the process, and because it is an endless, constantly recharging system, hydropower is defined as a renewable energy by the Environmental Protection Agency” [34]. In contrast, pumped hydro energy depends on water being transferred from a reservoir located at a lower height to a higher one, requiring pumps that use the surplus energy from the same system in times of low demand and an external energy supply at other times. The data indicate that China remains, by far, the top producer of renewable hydropower, while Brazil replaces the US in second place, as seen in figure 3.
Among the group of countries committed to renewable hydropower—and not pure pumping—practically all the regions of the world are represented, in addition to the top five countries in terms of renewable capacity (although Germany occupies a low ranking, at position 33).
Therefore, in addition to this latter group of five countries, we address other countries located in different regions of the world that generally go unnoticed in the global panorama; one of the reasons for this neglect is that their energy transitions are often characterized by isolated efforts focused on a single source of green energy, a fact that is generally related to their economic limitations.
Figure 3.
Installed capacity of renewable hydropower (GW—2020).
This is precisely the case for South Africa, which in 2020 had the highest RE installed capacity on the African continent at 9.6 GW, of which 5.9 GW originated from solar energy due to South Africa’s 21 photovoltaic solar energy installations. This country expects to generate 1.7 GW more in 2030 by investing especially in the concentrated solar energy industry [35]. In the rest of Africa, Egypt has installed Benban Solar Park, the fourth-largest solar power plant in the world, producing 1,650 MW.
In the Middle East, Iran, one of the world’s largest oil producers, has by far the greatest commitment to RE among the countries in the region, with an installed capacity of 14 GW in 2020, which represented 58% of the regional total. Although Iran has other natural resources [36], 95% of its RE installed capacity corresponds to hydropower. The United Arab Emirates (UAE), with 2.5 GW, has developed the Noor Abu Dhabi Solar Plant, which produces 1.1 GW and is the fifth largest in the world. Additionally, one of the UAE’s innovations consists of its very recent launch of the world’s first project to evaluate extraction of water from the atmosphere, that is, Atmospheric Water Generation (AWG). Using solar/thermal as a renewable energy source, the project will be deployed at the Abu Dhabi R&D center in Masdar City [37, 38]. Another project fed by solar energy in this country is the pilot plant to obtain hydrogen, located near the Mohammed bin Rashid Al Maktoum Solar Park (MBR) Solar Park, which currently has a capacity of just over 1 GW, which is expected to deliver approximately 20.5 kg of hydrogen per hour [39, 40].
Turkey stands out in Eurasia due to its 49 GW in installed RE, 63% comes from hydroelectric energy, 18% from wind and 13% from solar. It is also trying to add 1.5 GW of installed capacity in 2021. Regrettably, among the 238 projects involved in the achievement of this goal, which a re associated with US$ 27 billion in expected investments [41, 42], the construction of the Ilisu Dam on the Tigris River has generated great controversy due to the high ecological, social and cultural costs required to transform approximately 145 km of the river along with another 242 km of its tributaries into a vast reservoir that will submerge almost 200 villages and displace approximately 80,000 people [43].
Latin America is well represented in terms of current RE installed capacity with Venezuela at 15.4 GW, Mexico at 12.6 GW and Colombia at 11.9 GW; however, as is the case in other countries in the region, including Brazil, diversification is practically nil, since hydropower in Venezuela represents 99% of the installed renewable capacity and in Colombia 93%. Mexico is the exception because its distribution of renewable capacity includes hydropower, wind, solar, bio and geothermal—an example that other countries in the region could follow since they have the necessary natural resources.
Finally, in Asia, under the great shadow of China and India, Japan was ranked sixth in the world in 2020 (immediately after Germany) thanks to its 123 GW renewable installed capacity, which is distributed between hydropower (41%), wind (3%), solar (54%) and bioenergy (1%). Japan is distantly followed by Vietnam, with 35 GW of renewable installed capacity divided across hydropower (51%), wind (2%), solar (46%) and bioenergy (1%).
Population
Poverty line
Poverty line
Access
Per capita electricity use
Relative growth (%)
Rank
Country
2020
<US$ 1.90 (%)
<US$ 3.20 (%)
2019 (%)
kWh 2000
kWh 2020
1
China
1,439,323,774
0.2
2.1
100
382
5,297
1,287
2
USA
331,002,647
1.0
1.3
100
11,048
12,235
11
3
Brazil
212,559,409
4.6
9.1
99.8
1,432
2,850
99
4
India
1,380,004,385
10.6
22.0∗
97.8
238
972
309
5
Germany
83,783,945
0.0
0.2
100
6,726
6,771
0.66
6
Japan
126,476,458
0.7
0.9
100
5,513
7,446
35
7
Canada
37,742,157
0.3
0.5
100
17,829
16,648
−7
8
France
65,273,512
0.02
0.02
100
6,216
8,097
30
9
Italy
60,461,828
1.4
1.8
100
3,262
4,554
40
10
Russian Fed.
145,934,460
0.03
0.3
100
6,729
7,026
4
12
Turkey
84,339,067
0.4
2.2
100
696
3,464
397
15
Vietnam
97,338,583
1.4
5.7
99.4
83
2,745
3,198
17
Mexico
128,932,753
1.7
6.6
100
1,266
2,349
86
22
Venezuela
28,435,943
5.4
n.d.
100
2,730
3,127∗∗
15
26
Colombia
50,882,884
4.9
12.8
99.7
981
1,497
49
27
Iran
83,992,953
0.7
3.9
100
822
4,000
387
37
South Africa
59,308,690
19.7
38.5
85
4,391
3,759
−14
46
Egypt
102,334,403
4.1
30.0
100
614
1,928∗∗
214
70
UAE
9,890,400
0.0
0.0
100
8,920
13,308∗
49
Table 3
Poverty and energy access and consumption per capita (selected countries, 2020).
Sources: Population [44]; poverty lines [45]; access and per capita electricity use [46].(∗) CIA Factbook [47].(∗∗) Per capita electricity use—2019.
To further investigate the complex context of the transition towards renewable energies, Table 3 allows comparison of sociodemographic data, access to electricity at the national level and changes in consumption during the last twenty years for the top ten countries with the highest current RE installed capacity and the group of countries highlighted as regional leaders.
The first column shows the ranking of each country according to its installed capacity in RE in 2020 and reveals significant advances in the energy transitions of countries that—despite the absence of the optimal socioeconomic conditions for implementing transition—still reach high rankings among the 222 countries that report to IRENA. One of the variables that partially reveals countries’ socioeconomic conditions is the percentage of the population below the extreme poverty and poverty lines; the population that remains below these thresholds is considerable among some countries in the table, particularly South Africa and India. It is important to keep in mind that the relationship between poverty and investment in basic utilities infrastructure, including energy, is bidirectional, with each one being both cause and consequence of the other; limited resources do not allow investment in energy, and if there is no energy, the population remains poor [48–50]. This problem reflects issues such as governance and social justice, among others.
Another variable that provides valuable information is the growth in energy access (energy consumption growth) during the last twenty years; although growth in energy access is usually understood as a positive indicator per se, for example, in the United Nations’ Human Development Reports [51–53], these figures deserve further analysis. If the increase in consumption is focused on the industrial sector and reflects production increases, or on the social sector, e.g., hospitals or schools, reflecting improved living conditions among the population, such growth represents a positive indicator. However, within the industrial sector, such growth can also result from energy losses in distribution processes or from the use of obsolete and inefficient infrastructure and equipment, among various other reasons.
Energy consumption growth in the domestic sector could entail the same problems, since it may imply either greater access to goods and services that require the use of electrical energy or resource waste and negligence in conservation, for example, in the use of heating and cooling equipment. Approaches that portray energy consumption reductions as a positive indicator focus on technological innovations and greater energy efficiency, as well as more responsible use among individual consumers [54–56]. Hence, energy consumption increases cannot be understood as a positive phenomenon per se but rather require case-by-case analysis; the group of countries in this table offers good examples in this regard. The characteristics of some of them are briefly analyzed below.
Vietnam’s high ranking among the world’s top renewable energy producers is a good example of the aforementioned close relationship between a country’s economic conditions and energy consumption. Vietnam’s steady and high economic growth reached 6% between 2014 and 2017 and 7% from 2018 [57] and, together with the country’s population growth, has led to increased electricity consumption per year (169% between 2010 and 2015 and 147% between 2015 and 2019) [33]; however, as this consumption is growing faster than the country’s GDP, and considering the pollution derived from higher access to motorbikes and cars, Vietnam has chosen renewable energy development. These contributions by Vietnam are particularly surprising because even though it is a small country in area and is not necessarily a regional leader in other spheres, it shows a firm commitment to the energy transition, which it has endorsed in its national power development plan (PDP 8) for 2021-2030 period and the draft plan’s revisions.
In China, economic growth has also opened up opportunities to increase electricity access through renewable energy projects. Despite China’s GDP growth between 2009 and 2010, it has decreased since then—although it remained at 6% per year until 2019 [57]. Regarding electricity consumption, China’s consumption is massive: in 2010, its growth rate between 2010 and 2015 reached 140% and was 129% [33]between 2015 and 2019. Consequently, China’s efforts around the energy transition contrast with its very high growth in energy consumption, still based on fossil fuels to a great extent; it could be said that what is given with one hand is taken back with the other. However, it has enough time to fulfill its promise to reach “peak CO2 emissions by 2030 and achieve carbon neutrality by 2060” [58].
In the group of countries with more moderate growth in energy consumption, Iran has the fourth largest oil reserves and the second largest natural gas reserves. However, it committed to generating 7% of its electricity from renewable energy sources by 2020 to decrease its CO2 emissions. In this regard, the data series shows that although from 2000 this country emitted an average of 2.5% more emissions year after year, between 2009 and 2010, it reduced them by 3%, only to show annual increases since then of between 3 and 4%. Lowest emissions was seen in 2015, but from then until 2018, its emissions increased, while the country failed to fulfill the RE commitment made. Most of its energy plants rely on fossil fuels, especially natural gas, which accounts for 93% of the fossil fuels used for energy generation, while 84.8% of Iran’s electricity is generated at thermal power plants [59].
As another country with moderate consumption growth, the Russian Federation is a curious case, to say the least. Given its political and economic importance at the global level, the size of its territory, and the variety of its resource endowments, the country lags quite far behind its peers on renewable energy capacity. Table 3 shows that India, Brazil, France and Italy far exceed it in installed capacity. Calculations with 2019 figures show that 55% of its energy supply comes from gas, 19% from oil, 16% from coal, 7% from nuclear energy and just 2% from hydropower, while the energy secured from the set of other possible RE sources is less than 1% [33]. Russia’s low interest in RE can be explained by the fact that Europe is dependent on its gas supply, giving it an enormous geopolitical power. In fact, the current energy crisis in Europe, amidst the Ukraine invasion, and due to the dependence on Russian gas, reliably demonstrates that energy security and sovereignty must be understood as a matter of state. On the other hand, it is worrying to note that even though European countries have favorable economic conditions, which in turn gives them access to technological development, energy transition takes time, and if a prompt solution to the crisis is not found, a vast number of people will suffer the consequences.
As for countries that have reduced their consumption, Canada is the only one, thanks to technological innovations. Although the figures show a large consumption reduction for South Africa as well, this is for the wrong reasons; in addition to the pandemic, the country’s old electrical installations, together with serious maintenance problems, have led to a series of operational failures and power generation was 5 MW below installed capacity, reflected in untimely, constant and protracted power outages. It is expected that the way out of this situation will be through private investment and that the Electricity Supply Commission (ESKOM), the state energy company, can alleviate the pressure to deal with the aforementioned high indebtedness and low state investment.
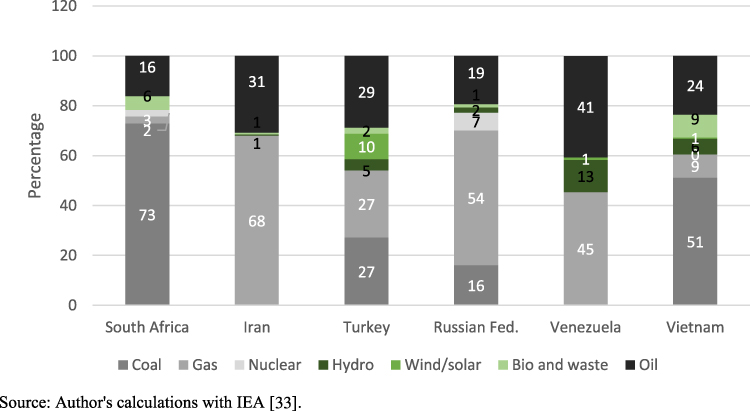
However, the data demonstrate (figure 4) that in the global renewable energy panorama, emerging countries have a greater presence of renewables in their energy matrix than industrialized/high-income countries. A comparison between figures 2 and 4 reveals not only marked differences between the set of countries but also far more progress in the energy matrix transition among emerging countries than among industrialized ones.
Figure 4.
Emerging countries’ renewable energy supply by source (%, 2019).
Among this set of countries, there is also less variety in energy supply sources. Only the Russian Federation and South Africa use nuclear energy, but in the latter country, this source corresponds to just 2% of supply; however, it does not have hydropower. Vietnam and Turkey are the most diverse in terms of the energy supply sources. Vietnam is less dependent on oil, which accounts for only 24% of its supply, compared to 29% in Turkey, but in the latter, only 27% of its energy supply comes from coal, in comparison with 51% in Vietnam.
Table 4 displays the supply distribution between fossil and renewable energy sources for the set of countries analyzed above, sorted by their renewable energy share in 2019; the second column corresponds to the current global ranking by RE installed capacity.
Rank
Rank on global RE
Country
Fossil (%)
Renewable (%)
1
3
Brazil
54
46
2
4
India
77
23
3
12
Turkey
83
17
4
5
Germany
84
16
5
15
Vietnam
84
16
6
22
Venezuela
86
14
7
1
China
90
10
8
17
Mexico
90
10
9
6
Japan
92
8
10
2
USA
92
8
11
37
South Africa
94
6
12
10
Russian Fed.
96
4
13
27
Iran
99
1
14
70
UAE
99
1
Table 4
Supply distribution between fossil and renewable energy sources (selected countries, 2019).
Source: Author’s calculation based on IRENA (2021) [4].
With the exceptions of Germany and China, the countries with the highest share of renewables in their energy matrix are emerging/medium-GDP countries in Eurasia, Asia and Latin America. The US occupies only 9th place, and the Russian Federation’s low energy diversity and continuing high dependence on fossil fuels is evident once again.
The next section addresses the scope of the energy transition in terms of reducing greenhouse gases among these and other emerging countries.
Renewable energy in emerging countries and CO2 emissions
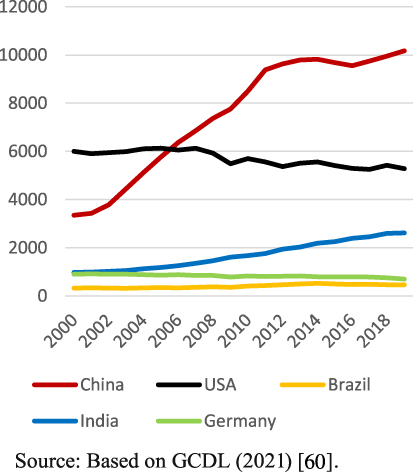
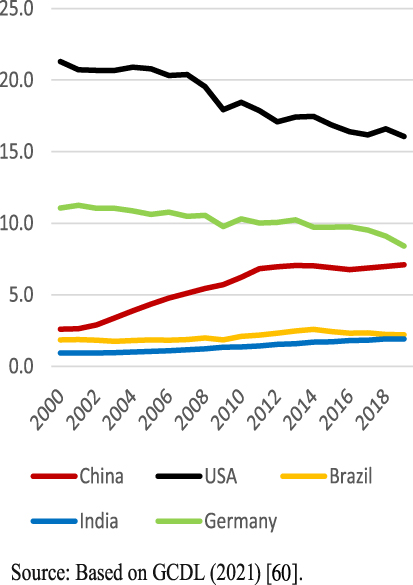
At the national level, the US has historically been the world’s largest CO2 emitter and retained this record until 2006 (figure 5, Ref. [60]), when China’s emissions began to far outpace those of the US. In 2010, the US’s highest emissions originated from the transportation industry, followed by the electricity generation sector; by 2019, 29% originated from electricity generation, 25% from transportation, 23% from industrial processes, 13% from domestic and commercial use, and 10% from agriculture [61]. However, per capita data show that although there has been a modest downward trend in consumption, among the countries with the world’s highest renewable capacity, the US is by far the country that emits the most CO2 (figure 6).
Figure 5.
CO2 emissions (million tons) of the top five countries with the highest RE capacity.
Figure 6.
CO2 emissions per capita (tons) of the top five countries with the highest RE capacity.
Returning to national data, China’s CO2 emissions surpassed that of the US mainly due to its burgeoning but still highly coal-dependent economy. In 2019, China emitted nearly double (10,175 million tons) the emissions of the US (5,285 million tons), but each Chinese citizen emitted 9 fewer tons of CO2 than each US citizen. China’s dependence on coal is slightly higher than India’s, but unlike India, it has set its own goals for emissions reduction; although “India has one of the lowest prices for solar energy in the world and its commitment in Paris to reduce its emissions was praised, with no plans to give up coal, [India’s] emissions are on the rise” [62]. In fact, India currently ranks as the third-largest CO2 emitter in the world, but also is part of the top five countries by renewable capacity, has the lowest per capita emissions in the latter group. Germany, for its part, also shows high emissions per capita, at 1.3 more tons per person than those of China, although at the national level, Germany has among the lowest emissions in the top five.
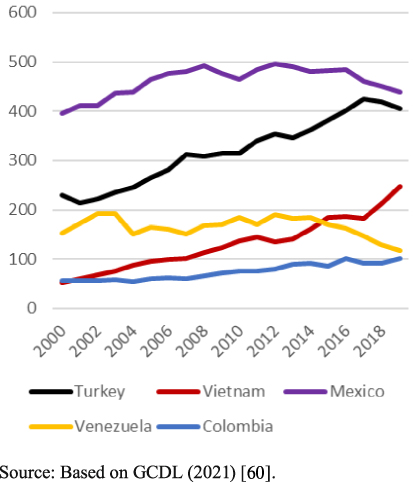
With respect to large CO2 emitters, note that in 2019, the Republic of Korea ranked as the ninth largest CO2 emitter globally but ranks only at 19 on RE installed capacity. However, this could be explained not only by the fact that Korea’s territorial area is one-third that of Vietnam, which is already a very small country, but also by the scarcity of its natural resources. Continuing with the countries whose renewable energy performance is less prominent globally but of regional importance, we find dissimilar behaviors in terms of their national (figure 7) and per capita (figure 8) CO2 emissions.
Figure 7.
CO2 emissions (million tons) of the countries with the highest RE capacity at the regional level (Eurasia, Asia and Latin America).
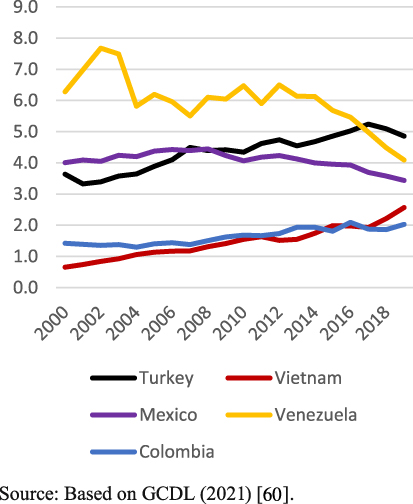
Figure 8.
CO2 emissions per capita (tons) of the countries with the highest RE capacity at the regional level (Eurasia, Asia and Latin America).
While Vietnam, Turkey and Colombia all showed growth in emissions during recent decades, it was most pronounced in Vietnam, quintupling from 52 million tons in 2000 to 248 million tons in 2020, while that of Turkey nearly doubled from 230 to 405 million tons. The reasons are population growth and increased access to and use of electricity (Table 2). Mexico, for its part, has the highest national emissions in the group: among the countries in its region in 2019, it emitted 322 million tons more than Venezuela and 336 million tons more than Colombia. Although Mexico is the only country in this group that has reduced its emissions, along with Venezuela, this reduction has been for reasons other than energy efficiency policies or strategies; the widespread political crisis in which Venezuela has been submerged for almost ten years has led the country into a deep economic recession.
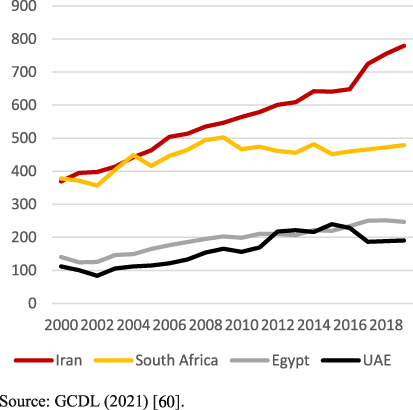
Finally, when we compare the national and per capita emissions of regionally prominent countries in the Middle East and in Africa, there are again significant variances.
Figure 9.
CO2 emissions (million tons) of the countries with the highest RE capacity at the regional level (Africa and the Middle East).
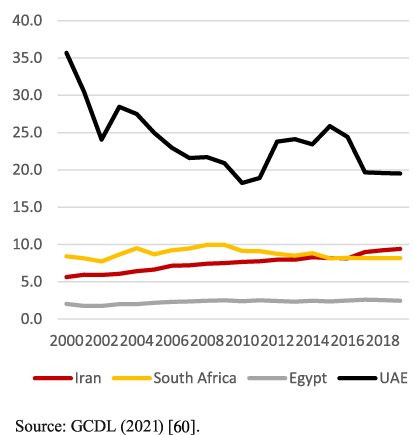
During these last two decades, the four countries showed significant growth in national emissions, particularly Iran, whose emissions more than doubled from 369 million tons in 2000 to 780 million tons in 2020; this is explained by the low diversity of its energy supply (figure 9) combined with its high dependence on gas, which produced 55% of its emissions in 2019, followed by oil, which produced 32% [60]. However, Iran’s per capita emissions data are very modest in comparison to those of the United Arab Emirates, whose national and per capita indicators show the opposite trends (figure 10). The UAE has low national emissions—in fact, the lowest of the group—and very high per capita emissions—the highest of the group by far; 73% of UAE’s emissions come from gas and 18% from oil, and despite its population being just over a tenth of Iran’s, its electricity consumption ranks third highest among the analyzed countries (figure 10).
Figure 10.
CO2 emissions per capita (tons) of the countries with the highest RE capacity at the regional level (Africa and the Middle East).
The usual contrast that can be observed between national and per capita CO2 emissions, together with the population’s energy consumption patterns, shows that the latter are a key variable to consider with respect to the urgent need to balance economic growth and CO2 emissions reduction. Nonetheless, figure 6 also shows that while emerging countries contribute little to carbon dioxide emissions, their overdependence on natural resources, particularly water, leaves them significantly exposed to the unfavorable effects of climate change.
Conclusions
The data show that the commitment to renewable energy has been strongly embraced; in fact, during the COVID-19 pandemic, renewable energy was one of the few industries whose growth remained constant. However, there is still a long path to tread and an urgent need to do so, as Asia is the only region in the world that has shown, year after year during the last decade, constant growth in its global share of RE installed capacity, while the remaining regions have shown decreases, the most significant being that in Europe. China’s contribution to Asian leadership has increased considerably year on year, reaching 70% in 2020, which clearly indicates China’s more than Asia’s’ supremacy.
Thanks to their large RE installed capacity, some individual countries compete with entire regions of the world: namely, the US, China, Brazil, Germany and Canada. Their rankings were practically static until 2020, when Canada lost its position to India.
Hydropower is the largest source of renewable energy in these countries, with percentages of between 62% and 89%, except in Germany, where solar energy represents 39% of its renewable supply. Nonetheless, data analysis shows that the share of RE in the total energy matrix is still minimal and a very small portion of the energy mix even among the world’s top countries by RE installed capacity (16% in Germany, 10% in China and 8% in the US). This underperformance, combined with the recent debates on what types and subtypes of hydropower may be considerable renewable, has brought emerging/middle-income countries onto the renewable’s scene.
Thus, the results of this research are novel, as it places special emphasis on the efforts, successes, and the mistakes of some non-industrialized countries in the implementation of RE projects, and not only focuses on the countries that are globally leading the race for the energy transition. The results show that in all regions of the world there are countries with significant progress, among which Vietnam and Mexico stand out despite their size and economic capacity.
In fact, the commitment of these middle-income countries emerging on the energy transition scene is promising. Data calculations on the distribution of fossil and renewable energy supply sources for the set of countries analyzed show that with the exceptions of Germany (4th) and China (7th), the top eight places with the most renewables in their national energy matrix are emerging/medium-GDP countries in Eurasia, Asia and Latin America.
Regarding the extent of CO2 emissions reductions, data analysis also shows that although economic growth brings with it, growth in CO2 emissions, individual energy consumption patterns have an even greater impact on emissions; the contrasts between the US and China or Iran and the United Arab Emirates are good examples.
Conflict of interest
The authors declare no conflict of interest.
References
1.
MartílI. Energía eólica (II): de la Segunda Guerra Mundial hasta hoy. Open Mind. 2021; https://www.bbvaopenmind.com/ciencia/medioambiente/energia-eolica-ii-de-la-segunda-guerra-mundial-hasta-hoy/ (accessed September 17, 2021).
2.
PazheriFR, OthmanMF, MalikNH. A review on global renewable electricity scenario. Renew Sustain Energy Rev. 2014;31: 835–845. doi: 10.1016/j.rser.2013.12.020.
3.
ShafieeS, TopalE. When will fossil fuel reserves be diminished?Energy Policy. 2009;37: 181–189. doi: 10.1016/j.enpol.2008.08.016.
4.
IRENA. Renewable capacity statistics 2021. Abu Dhabi: IRENA; 2021.
5.
IRENA. The IRENA renewable energy template. Abu Dhabi: IRENA; 2021.
6.
U.S. Office of Energy Efficiency & Renewable Energy. How Much Power is 1 Gigawatt? 12th August 2019. https://www.energy.gov/eere/articles/how-much-power-1-gigawatt (accessed September 1, 2021).
7.
EIA. U.S. Energy Information Administration (EIA). Freq Asked Quest; 2020. https://www.eia.gov/tools/faqs/faq.php?id=97&t=3 (accessed September 1, 2021).
8.
NCR. What is a Megawatt?2012. https://www.nrc.gov/docs/ML1209/ML120960701.pdf.
9.
DaviesE. Quora. How Many Homes Can One Gigawatt Energy Capacit Provid For?2019. https://www.quora.com/How-many-homes-can-one-gigawatt-in-energy-capacity-provide-for (accessed September 1, 2021).
10.
KentelE, AlpE. Hydropower in Turkey: Economical, social and environmental aspects and legal challenges. Environ Sci Policy. 2013;31: 34–43. doi: 10.1016/j.envsci.2013.02.008.
11.
MartínezV, CastilloOL. The political ecology of hydropower: Social justice and conflict in Colombian hydroelectricity development. Energy Res Soc Sci. 2016;22: 69–78. doi: 10.1016/j.erss.2016.08.023.
12.
NormyleA, PittockJ. A review of the impacts of pumped hydro energy storage construction on subalpine and alpine biodiversity: Lessons for the Snowy Mountains pumped hydro expansion project. Aust Geogr. 2020;51: 53–68. doi: 10.1080/00049182.2019.1684625.
13.
SinghA, MandavkarR, SinghS, Prabhu BhembreR, JainD, DSilvaW. Socio-environmental impacts of hydro power technology- a review. In: ASME 2021 Power Conference. New York, NY: American Society of Mechanical Engineers; 2021. doi: 10.1115/POWER2021-64157.
14.
JolyD, JungJW, KimID, DemadrilleR. Electrospun materials for solar energy conversion: Innovations and trends. J Mater Chem C. 2016;4: 10173–10197. doi: 10.1039/c6tc00702c.
15.
SivaramV. Taming the sun: Innovations to harness solar energy and power the planet. Cambridge, MA: The MIT Press; 2018.
16.
LaxtonD. Innovations in the wind energy sector. Prague: Elsevier BV; 2020. doi: 10.2139/ssrn.3519886.
17.
ShieldsM, BeiterP, KleiberW. Spatial impacts of technological innovations on the levelized cost of energy for offshore wind power plants in the United States. Sustain Energy Technol Assess. 2021;45: 101059. doi: 10.1016/j.seta.2021.101059.
18.
AgarwalN, BremA, editors. Frugal innovation and its implementation. Contributions to Management Science. Cham: Springer International Publishing; 2021 doi: 10.1007/978-3-030-67119-8.
19.
Blackridge Research & Consulting. India wind power market outlook to 2025. Hyderabad, Telangana, India: 2020.
20.
PetrescuR, AversaR, ApicellaA, PetrescuF. Green energy to protecting the environment. Rev Gestão Inovação e Tecnol. 2017;7: 722–3743.
21.
PPSP. Pecan Prairie Solar Project 2020. https://www.pecanprairiesolar.com/ (accessed September 17, 2021).
22.
BioVec. Biogas in India; 2019. https://biovec.net/biogas-en-india/.
23.
Asia Link America. India would bet on biogas to reduce pollution; 2019.
24.
GWEC. Global Wind Report 2021. Brussels: GWEC; 2021.
25.
World Energy Trade. Brasil incluye cuatro nuevos proyectos hidroeléctricos; 2019. https://www.worldenergytrade.com/energias-alternativas/agua-y-vapor/brasil-incluye-cuatro-nuevos-proyectos-hidroelectricos (accessed September 17, 2021).
26.
BanAmericas. BanAmericas. Pronost Crecim Merc Bras Del Biogás; 2020. https://www.bnamericas.com/es/noticias/pronostican-crecimiento-de-mercado-brasileno-de-biogas.
27.
BWE. Germand Wind Energy in numbers. Bundesverband Wind; 2021. https://www.wind-energie.de/english/statistics/statistics-germany/ (accessed August 31, 2021).
28.
BSW Solar. Bundesverband Solarwirtschaft e.V. Sol Batter Boom; 2021. https://www.solarwirtschaft.de/en/2021/02/18/solar-battery-boom/ (accessed August 31, 2021).
29.
Statista. Number of biomass power plants in Germany from 2008 to 2020; 2020.
30.
BilgiliM, OzbekA, SahinB, KahramanA. An overview of renewable electric power capacity and progress in new technologies in the world. Renew Sustain Energy Rev. 2015;49: 323–334. doi: 10.1016/j.rser.2015.04.148.
31.
ChappellB. Renewable energy growth rate up 45% worldwide in 2020; IEA Sees “New Normal”. Washington, DC: NPR; 2021.
32.
World Resources Institute. Statement: China Aims for Carbon Neutrality Before 2060; 2020. https://www.wri.org/news/statement-china-aims-carbon-neutrality-2060 (accessed August 31, 2021).
33.
IEA. World energy balance. Paris: IEA; 2021.
34.
CournoyerC. Is hydropower a renewable energy or not? Sacramento, CA: Governing; 2013.
35.
AkinbamiOM, OkeSR, BodunrinMO. The state of renewable energy development in South Africa: An overview. Alexandria Eng J. 2021;60: 5077–5093. doi: 10.1016/j.aej.2021.03.065.
36.
KhojastehD, KhojastehD, KamaliR, BeyeneA, IglesiasG. Assessment of renewable energy resources in Iran; with a focus on wave and tidal energy. Renew Sustain Energy Rev. 2018;81: 2992–3005. doi: 10.1016/j.rser.2017.06.110.
37.
LiR, ShiY, AlsaediM, WuM, ShiL, WangP. Hybrid hydrogel with high water vapor harvesting capacity for deployable solar-driven atmospheric water generator. Environ Sci Techonol. 2018;11367–11377. doi: 10.1021/acs.est.8b02852.
38.
ShouridehAH, Bou AjramW, Al LamiJ, HaggagS, MansouriA. A comprehensive study of an atmospheric water generator using Peltier effect. Therm Sci Eng Prog. 2018;6: 14–26. doi: 10.1016/j.tsep.2018.02.015.
39.
NoussanM, RaimondiPP, ScitaR, HafnerM. The role of green and blue hydrogen in the energy transition—a technological and geopolitical perspective. Sustainability. 2020;13: 298. doi: 10.3390/su13010298.
40.
TouiliS, Alami MerrouniA, El HassouaniY, AmraniA, RachidiS. Analysis of the yield and production cost of large-scale electrolytic hydrogen from different solar technologies and under several Moroccan climate zones. Int J Hydrogen Energy. 2020;45: 26785–26799. doi: 10.1016/j.ijhydene.2020.07.118.
41.
Ernst & Young. A clean COVID-19 recovery: The global opportunity 13,000 renewable energy projects for a green recovery. London: 2021.
42.
KaratopB, TaşkanB, AdarE, KubatC. Decision analysis related to the renewable energy investments in Turkey based on a Fuzzy AHP-EDAS-Fuzzy FMEA approach. Comput Ind Eng. 2021;151. doi: 10.1016/j.cie.2020.106958.
43.
HockenosP. Turkey’s dam-building spree continues, at steep ecological cost. Yale Environ 360; 2019.
44.
PopulationPyramid. List of countries sorted by population in 2020; 2021. https://www.populationpyramid.net/es/población-por-pais/2020/ (accessed September 4, 2021).
45.
GCDL. Global extreme poverty. Our World Data; 2021. https://ourworldindata.org/extreme-poverty.
46.
GCDL. Per capita electricity consumption. Oxford: Our World in Data; 2021.
47.
CIA. Factbook. New York, NY: Simon & Schuster; 2021.
48.
GertlerP, ShelefO, WolframC, FuchsA. Poverty, growth and the demand for energy. Stockholm: Institute for International Economic Studies; 2012.
49.
KhanSAR, ZhangY, KumarA, ZavadskasE, StreimikieneD. Measuring the impact of renewable energy, public health expenditure, logistics, and environmental performance on sustainable economic growth. Sustain Dev. 2020;28: 833–843. doi: 10.1002/sd.2034.
50.
MartílI. Energy and inequality, a wonderfully matched marriage. Open Mind. 2021; https://www.bbvaopenmind.com/en/economy/global-economy/energy-and-inequality/ (accessed September 17, 2021).
51.
IAEA & UN. Energy indicators for sustainable development: country studies on Brazil, Cuba, Lithuania Mexico, Russian Federation, Slovakia and Thailand. Amsterdam: Elsevier; 2007.
52.
European Environment Agency. Are we decoupling energy consumption from economic growth? Copenhagen: European Environment Agency; 2013.
53.
MenegakiAN, TugcuCT. Rethinking the energy-growth nexus: Proposing an index of sustainable economic welfare for Sub-Saharan Africa. Energy Res Soc Sci. 2016;17: 147–159. doi: 10.1016/j.erss.2016.04.009.
54.
Moreland Energy Foudation. Energy reduction plan. Sydney: Australian Energy Foundation; 2015.
55.
EsenÖ, BayrakM. Does more energy consumption support economic growth in net energy-importing countries. J Econ Financ Adm Sci. 2017;22: 75–98.
56.
BercuA-M, ParaschivG, LupuD. Investigating the energy–economic growth–governance Nexus: evidence from central and eastern european countries. Sustainability. 2019;11: 3355.
57.
The World Bank. GDP growth (annual %). World Bank Data; 2022. https://data.worldbank.org/indicator/NY.GDP.MKTP.KD.ZG?locations=VN (accessed March 7, 2022).
58.
FrangoulA. President Xi tells UN that China will be “carbon neutral” by 2060. New York, NY: UN; 2020.
59.
SolaymaniS. A review on energy and renewable energy policies in Iran. Siustainabilty. 2021;13: 7328. doi: 10.3390/su13137328.
60.
GCDL. CO2 emissions. Oxford: Our World in Data; 2021. https://ourworldindata.org/co2-emissions.
61.
EPA. Inventory of U.S. greenhouse gas emissions and sinks. Washington, DC: USEPA; 2020.
62.
HemalathaK. India: entre la energía solar y el carbón. Bonn: DW.com; 2020.