Open Access is an initiative that aims to make scientific research freely available to all. To date our community has made over 100 million downloads. It’s based on principles of collaboration, unobstructed discovery, and, most importantly, scientific progression. As PhD students, we found it difficult to access the research we needed, so we decided to create a new Open Access publisher that levels the playing field for scientists across the world. How? By making research easy to access, and puts the academic needs of the researchers before the business interests of publishers.
We are a community of more than 103,000 authors and editors from 3,291 institutions spanning 160 countries, including Nobel Prize winners and some of the world’s most-cited researchers. Publishing on IntechOpen allows authors to earn citations and find new collaborators, meaning more people see your work not only from your own field of study, but from other related fields too.
Sampling and analysis occur along the milk processing train: from collection at farm level, to intake at the diary plant, the processing steps, and the end products. Milk has a short shelf life; however, products such as milk powders have allowed a global industry to be developed. Quality control tests are vital to support activities for hygiene and food standards to meet regulatory and customer demands. Multiples of chemical and microbiological contamination tests are undertaken. Hazard analysis testing strategies are necessary, but some tests may be redundant; it is therefore vital to identify product optimization quality control strategies. The time taken to undergo testing and turnaround time are rarely measured. The dairy industry is a traditional industry with a low margin commodity. Industry 4.0 vision for dairy manufacturing is to introduce the aspects of operational excellence and implementation of information and communications technologies. The dairy industries’ reply to Industry 4.0 is represented predominantly by proactive maintenance and optimization of production and logistical chains, such as robotic milking machines and processing and packaging line automation reinforced by sensors for rapid chemical and microbial analysis with improved and real-time data management. This chapter reviews the processing trains with suggestions for improved optimization.
Dairy Processing Technology Centre (DPTC), University of Limerick, Ireland
Krzysztof A. Zacharski
Dairy Processing Technology Centre (DPTC), University of Limerick, Ireland
Mark Southern
Dairy Processing Technology Centre (DPTC), University of Limerick, Ireland
Enterprise Research Centre, University of Limerick, Ireland
Paul Hogan
Dairy Processing Technology Centre (DPTC), University of Limerick, Ireland
Michael P. Ryan
Microbiology Laboratory, School of Natural Sciences, University of Limerick, Ireland
Catherine C. Adley*
Microbiology Laboratory, School of Natural Sciences, University of Limerick, Ireland
*Address all correspondence to: catherine.adley@ul.ie
1. Introduction
The implementation of strategies to improve and strengthen milk process optimization is of vital importance within the dairy industry. The rapid deterioration of milk products forces dairy processors to critically optimize and plan their production schedules. The business model is to look at the work force, to reduce or eliminate any time or/and resource wastage, unnecessary costs, bottlenecks, and mistakes while attaining the process objective of creating a quality product [1].
The global dairy sector is currently going through change. The Food and Agricultural Organization of the United Nations (FAO-UN), dairy price index shows prices 26% below its peak from February 2014 [2]. The demand for milk products from China is beginning to slow, trade sanctions on Russia and the end of “milk quotas” within the European Union (EU) has caused a period of excess supply and low prices [3]. Notwithstanding this, the dairy sector is expanding and projected to grow at a rate of 1.8% per year over the next 10 years, to 177 million tons of powdered milk by 2025 [4]. This increase is mainly due to rising urbanization and growing incomes in emerging markets [5]. In the EU, however, dairy farmers have used intervention stocks to shield themselves from poorer international prices. In September 2017, for instance, EU farmers consigned 16,597 tons of skimmed milk powder (SMP) to the interventions stock at Euro €1.698 [6].
In addition, changing consumer demand patterns are affecting food production. The “Traditional” value drivers of price, taste, and convenience have been complemented by newer and “Evolving” drivers such as health and wellness, safety, social impact, and experience. Central to all of these drivers is a need for transparency from food companies [5]. Given the ever-changing nature of the consumer food value drivers, dairy producers must look to their production processes to innovate with new products and to optimize output without compromising on quality and safety.
The world’s milk is predominantly cow’s milk, followed by buffalo milk. The leading producers include, Asia (30%), followed by the EU (28%), North and Central America (18%), South America (9%), other European countries (9%), Africa (5%), and Oceania (5%) [7]. To be named a dairy product, food must be produced from the milk of cows, buffalo, goats, etc. The dairy sector includes food such as liquid milk, milk powders, cheese, butter, and yogurt, as well as ice cream. Several factors including genetics, and breed of animal, environment, stages of lactation, parity, and nutrition, together determine the final composition of milk [8]. Milk and dairy products are significant sources of protein, essential minerals (calcium, potassium, magnesium, phosphorous, sodium, iodine) and several vitamins, (the fat-soluble vitamins A, D, E, K, and B1, B3, B6, B12). In a Western diet, dairy products provide between 40 and 70% of the recommended daily calcium intake. Cow’s milk consists of about 87% water (Table 1), and 12–13% total solids. The solids consist of fat ~4% and solids-not-fat (SNF) ~9%, such as proteins, lactose, and various minerals and vitamins. Milk proteins consist of whey and caseins; caseins have four different species (αS1, αS2, β, and κ-caseins) which are separate molecules, but they do possess similarity in structure and they comprise around 80% of total milk protein. The major whey proteins in cow and sheep’s milk are β-lactoglobulin and α-lactalbumin; the other proteins are serum albumin and immunoglobulins. Minor proteins include lactoferrin (LF), an iron binding protein and β2-Microglobulin—part of the Major Histocompatibility Complex II (MHC II), the rest are mostly enzymes including; lactoperoxidase, an enzyme that breaks down hydrogen peroxide, lysozyme which breaks down bacterial cell walls and has low activity in cow milk, proteases, protease activators, nucleases, glycosidases, and others. The milk proteins contain the nine essential amino acids required by humans, making it an important human food. The caseins are easily digested, while the whey proteins are relatively less digestible in the intestine.
The moisture content does not include water of crystallization of the lactose, the milk solids-not-fat content includes the water of crystallization of the lactose (Source: [11, 12]).
The milk fat content varies within the same dairy products and between different dairy products. Raw farm milk, full-fat milk, semi-skimmed milk, and skimmed milk have their own percentage of fat. Raw milk normally has a fat content of ~4.4 g of milk fat per 100 g. This can be skimmed to obtain lower fat varieties. Full-fat milk is standardized to 3.5% of fat and semi-skimmed milk contains ~1.5% fat. Skimmed milk and buttermilk are very low in fat and, on average, contain 0.1 or 0.2% fat, respectively. The fat content of milk and cream is also known as butterfat, an important factor in determining the price to be paid for milk supplied by farmers in many countries. Milk sold to the consumer is standardized with a range of different fat content choices. However, international variances in standardization mean that the fat percentage for (semi)-skimmed, whole milk, and buttermilk can differ between countries. Modifications in the composition of milk are allowed, if they are indicated on the packing of the product, so that it can be easily seen and read, complying with the obligation as regards nutrition labeling, laid down by the countries regulations. In the case of the EU, regulation No. 1169/2011 applies on the provision of food information to consumers [9], plus providing an indication of origin, is considered of particular interest. The US Public Health Service (USPHS) Milk Ordinance and Code recommends a minimum of 3.25% butterfat in farm milk, as the official national standard [10].
Milk is not necessarily a local product and has developed into a global trade with the development of milk powders. In particular, whole milk powder (WMP) and skimmed milk powder (SMP) are the most traded agricultural commodities globally, as percentage of production traded, while fresh dairy products, with less than 1% of production traded are the least traded agricultural commodity [4]. The dairy industry, however, has been targeted in the climate change debate as it has been estimated that 14.5% of greenhouse gas emissions come from livestock with beef and milk production the main culprits [13, 14]. Extreme changes in climate can affect the microbiological safety of food. Wet conditions are favorable to pathogen growth and may result in increased risk of food contamination, including mycotoxin. Aflatoxin M1 is the most studied mycotoxin in milk and levels exceeding the EU maximum level (0.050 μg/kg) have been found [15]. Climate effects on animal diseases lead to increased use of veterinary medicines resulting in drug resistance and anthropogenic (synthetic) chemicals with the potential for transmission of chemical residues into the food chain. The more frequent and intense rainfall that is predicted could encourage the spread of perchlorate through surface runoff with the potential to enter the food chain via cow’s milk [16]. Perchlorate reduces thyroid hormone production in the thyroid gland [17].
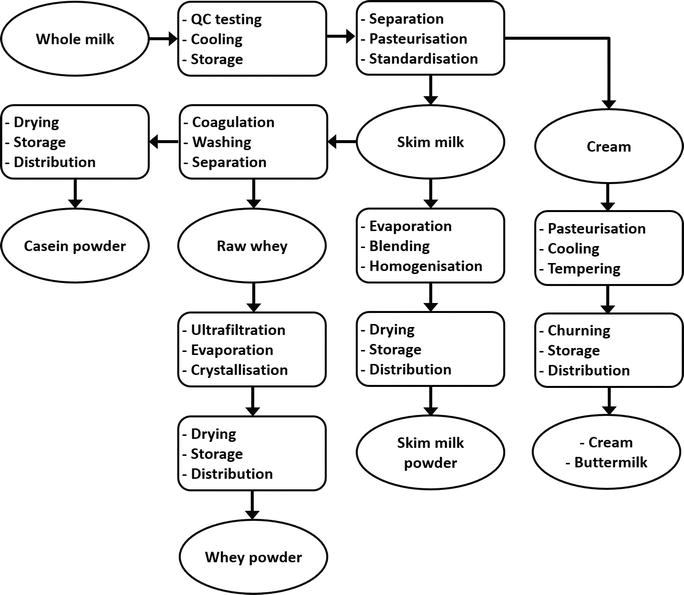
The flow diagram for milk processing is presented in Figure 1. Milk arrives at the milk dairy processing plant over the weighbridge and the weight of milk is automatically recorded. At the same time, data from an on-board computer is downloaded wirelessly to a data capture system, which holds the records of the temperature and volumes of milk collected from each farm. The temperature should be at 4–6°C. Milk samples using sterile containers are collected automatically from each supplier at source and are delivered to a laboratory technician for detailed analysis. Milk that deviates in composition, taste, and smell from normal milk receives a lower quality rating. The technician also takes a composite sample, from each compartment in the refrigerated truck, which is compartmentalized to reduce sloshing of the milk. The samples from each compartment are tested for acidity, antibiotics, added water, fat, and protein content. These analytical tests and methods are determined by international standards as outlined in Table 2.
The ISO standards catalog ISO/TC34/SC5 [18] lists all milk and milk products standards, while other standard sets include, microbiology of the food chain, microbiological quality of milk, etc. The bacterial quality of the milk is also measured and these specify tests are outlined later.
The titratable acid test measures the acidity of the milk. Both titratable acidity (TA) and pH are measures of acid. TA is a more reliable indicator because relative to pH measurement, it is more sensitive to small changes in milk acidity, especially important in cheese making. The acidity of milk is of two types; natural acidity due to citrates and phosphates present in the milk and dissolved CO2 during the processing of milking. The second is the developed acidity due to lactic acid produced by bacteria using the lactose in the milk as a nutrient, converting it to lactic acid. The acidity of milk measures the total acidity (natural acidity of milk and developed acidity). The International Standard Method for titratable acid is ISO 6091:2010 [19]. Titratable acidity is a measure of the buffering of milk between pH 6.6 and 8.3 (phenolphthalein endpoint) [26]. The appearance of a faint pink color, which signals the endpoint and the number of ml of NaOH used to reach the endpoint, is recorded. This value is called the “titer,” titratable acidity is reported as percent lactic acid and is dependent on the volume of sample. As this test is dependent on the analyst reading eye measurement of the color change, it is prone to human error causing incorrect and unpredictable recording of results.
The antibiotic test uses kits known as Charm and Delvo tests. The Charm test is made by Charm Science Inc., e.g., one kit, the Charm Rosa TET–SL (www.charm.com), detects chlortetracycline, oxytetracycline, and tetracycline residues in raw milk in the initial assay at or below 100 ppb, which complies with the EU regulation No 2377/90 [27], ISO 26844:2006 [20], and Codex Alimentarius regulations CAC/MRL 2-2015 [28]. The Delvo test (a rapid kit developed by DSM, food and beverage section; see, https://www.dsm.com) can be specific for residues of β-lactam or broad-spectrum antibiotics. Considerable concerns regarding antibiotics in the food chain and antibiotic resistance transfer to human has been postulated, but in most cases, there is not sufficient evidence to demonstrate this conclusively [29].
Added water can be measured by changes in the freezing point of milk from its normal values, the current official freezing point limit is −0.525° Horvet or −0.505°C and was designed for whole-herd, bulk-tank samples, or processed milk samples. The freezing point of milk is the constant physical-chemical property of milk, which is determined only by its water-soluble components such as lactose, and salts, which in accordance with the Wigner law are held in milk at an approximately constant concentration. However, the mineral composition of milk depends on lactation, nutritional status of the animal, and environmental and genetic factors [30].
Adulteration of milk with water will cause a measureable rise of the freezing point of milk. The freezing point is also lowered by acidification of milk, which leads to protein denaturation. The freezing point is considered as an accurate and sensitive method, most laboratories use a cryoscopy, method that is the ISO reference method ISO 5764:2009 [21].
The average fat content of raw milk is ~4.4 g of milk fat per 100 g; with more than 400 various fatty acids (FA) being present in milk [31]. The milk fatty acids are derived almost equally from two sources, the feed and the microbial activity in the rumen of the cow [32]. A study of Swedish bovine milk found that the milk contained substantial quantities of unsaturated fatty acids with 4–10 carbon chains (C4:0–C10:0), about 2% each of saturated C18:2 and trans-C18:1, and almost no other long-chain polyunsaturated fatty acids. The most important fatty acid from a quantitative viewpoint was palmitic acid (C16:0), which accounted for approximately 30% by weight of the total fatty acids. Myristic acid (C14:0) and stearic acid (C18:0), made up 11 and 12% by weight, respectively [31]. Fatty acid composition can show rapid and significant variation in response to changes in diet. The ISO standard for fat determination is ISO 1736:2008 [22].
The fatty acid make-up of the milk can be altered by changes in diet [33], but are also affected by a number of factors, including diet composition, nutrient utilization, lactation cycle, breed of cows, with dietary variations changes up to 3% units, been reported [34]. Specific fatty acids produced during microbial fermentation of dietary fats in the rumen of the cows are responsible for low milk fat. 2–3 g of these fatty acids can decrease milk fat by 0.5% or more [35]. The Gerber method is a historic method still used today to find the fat content of milk in particular in milk powders. By using specific butyrometers designed especially for the different dairy products, e.g., for cream, ice cream, whole milk, or cheese butyrometers, with method modifications [36]. There are many suppliers of such analytical tools, e.g., Gerber instruments (http://www.gerber-instruments.com) or Brouwland instruments (https://www.brouwland.com). Infrared analysis (IR) is a commonly used method for the examination of milk and its components such as solid fat, milk proteins, or carbohydrates [37, 38]. An ISO standard 9622:2013 is available for IR applications for milk and milk products [39].
The protein fat and lactose content of milk has a bearing on the price the farmer achieves for its milk. Liquid milk contains around 3.4% protein. The proteins in milk were described previously. The determination of protein content of milk and milk products underpins the international trade in dairy products. There are different analytical approaches for the determination of protein quality for nutrition purposes and chemically defined protein. These are divided into three broad categories: (i) determination of total nitrogen, (ii) direct protein determination, and (iii) indirect protein determination [40]. The Kjeldahl method ISO 8968/1:2014 [23] and Dumas method ISO 14891:2002 [24] are the current international standards, and use chemical digestion and combustion approaches respectfully. The advantage of these methods is that they have high reliability and accuracy. Using these methods, around 95% of nitrogen in milk is found to be present as proteins, with the remainder as nonprotein nitrogen sources such as urea. Together these tests and values form the basis for testing the quality of milk and milk products.
The raw milk in the milk container truck, having passed the preliminary analytical tests, proceeds to whole milk intake bays and the milk hoses are connected up by the driver. The milk is pumped into bulk storage tanks called milk silos (capacity can be up to 300,000 l, plus). The driver enters the trucks identification number on the pump’s control panel or uses a key fob (a passive wireless electronic device that usually uses radio frequency ID technology) to start pumping into the whole milk silos. Unloaded milk is cooled automatically to 4–6°C with a heat plate exchanger (HPE) while pumped into the silo. The offload time and setup time taken to couple and decouple the milk intake hoses are areas where processing monitoring can be implemented. The pumping time can be variable, indicating performance specific to each pump and the flow rate represents a reasonable performance indicator. Other significant factors that can influence pumping time include the volume of milk in the receiving silo, the number of bends and valves in each pipeline, and the associated backpressure variations. At milk offload, process optimization can be achieved by ensuring pumps are working effectively, efficiently, and planning truck supply due to intelligent time slot management.
3.1. Separation, clarification, and centrifugation
Different milk processing plants have their own process trains. In many cases, milk must be clarified on reception at the dairy, to remove particles of dirt such as sand, soil, dust, and precipitated protein, which will protect downstream processing equipment. In addition, removal of bacteria, spores, and somatic cells from milk can be achieved with centrifugation and microfiltration techniques [41]. Somatic cells such as leucocytes are removed, which will reduce the presence of Listeria trapped inside the leucocyte [42]. Reduction in the microbial load at this point can decrease the burden of biofilms [43], which leads to more efficient work of the HPE [44]. Milk bacterial clarification also avoids problems during cheese aging, and improves shelf life and organoleptic properties of the dairy products. A clarifier is a type of centrifugal separator, but clarifiers and milk separators serve slightly different duties. All centrifuges can act as clarifiers; however, in general, only centrifuges with a high hydraulic capacity are used in this way. The clarifier can function with either cold (below 8°C) or hot milk (50–60°C).
The main use for centrifuges in diary processing plants is hot milk separation. The aim is to separate the globular milk fat from the serum, the skim milk. This process is known as skimming. This process is generally combined into the pasteurization line and joined with an in-line fat standardization system for both milk and cream. Separation normally takes place at 122–140°F (50–60°C). The fat content of the cream discharged from the separator can be controlled to a level of between 20 and 70%. The terminology for separation in the dairy industry includes continuous centrifugal separation of solid particles (Clarifier), separation of cream (Separator), or separation of bacteria (Bactofuge). The microbial quality of milk powders is highly significant and it is possible at this early phase of processing to remove 99.9% of the spore-forming bacteria by either bacto-fugation or microfiltration preceding heat treatment.
Standardization of milk is the alteration of fat and solids-not-fat (SNF) levels, i.e., raising or lowering of these levels. This is regularly carried out for the consumer market milk supply and in the production of other milk products including: condensed milk, milk powder, ice cream and cheese, etc. Standardization is typically carried out to create a uniform milk fat content in the final dairy product [45].
3.2. Pasteurization
Pasteurization was originally introduced to control Mycobacterium bovis, which causes tuberculosis (TB), which is no longer problematic as cows are tested for TB annually and removed from herds if they test positive for the disease [46]. The TB bacillus is a highly heat resistant microorganism; however, Coxiella burnetii, the cause of Q fever in humans [47], required pasteurization of 161°F (71.7°C) for 15 s, and is the current official standard for milk pasteurization [48], the standard vat pasteurization is 63°C (145°F) for 30 min. However, heat processing can result in the loss of subtle aroma and flavors components, loss of vitamins and natural antioxidants, the loss of texture and freshness, and the denaturation of proteins. The US Grade A pasteurization milk ordinance (PMO) is managed by the Departments of Health and Human Services and Public Health, and the Food and Drug Administration and gives the criteria concerning the milk parlor and processing plant design, milking practices, milk handling, sanitation, and standards for the pasteurization of Grade A milk products. Regulation of milk processing is controlled on each US state basis; however, all dairy products must meet the regulations outlined in the PMO for products that will be sold outside of that state [10].
The center for disease control (CDC) in the US, reported that unpasteurized milk is 150 times more likely to cause foodborne illness and results in 13 times more hospitalizations than illnesses involving pasteurized dairy products [49]. The dangerous bacteria include Salmonella spp., Escherichia coli, and Listeria monocytogenes; it is also for this reason milk is pasteurized. E coli 0157 emerged in 1982, while multidrug-resistant Salmonella typhimurium DT104 was reported in 1990 [50, 51] with some E. coli and Salmonella isolates resistant to seven antibiotics. The EU Center for Disease Control and Infection (ECDC) reported Listeriosis cases of 2536 in 2016, of which L. monocytogenes was most frequently detected in both soft and semi-soft cheeses prepared from raw milk (2.5%), while 0.7% of raw milk (n = 968) samples tested positive [52]. These pathogens can also be found in multiple food products including meat [53]. However, postpasteurization contamination has been found to be the most causative factor in microbial outbreaks due to milk products [54, 55].
3.3. Verifying the pasteurization process
The PasLite test is an internationally accepted method used by dairies and food manufacturers to verify pasteurization for many types of dairy products. The PasLite test verifies the completeness of milk pasteurization by detecting alkaline phosphatase, a natural enzyme in milk that is destroyed by the heat and hold time of pasteurization. The test takes 3 min and multiple samples can be run simultaneously, however only one sample can be read at a time [56].
When a dairy sample is mixed with PasLite reagents and incubated, the resulting solution emits light in an amount directly proportional to the phosphatase enzyme present. The Charm nova LUM ATP detection system is used to measure the light emitted and coverts light readings to enzyme units. Phosphatase readings greater than 350 mU/L indicate product pasteurization issues, according to US and EU pasteurization requirements. The PasLite test detection limit for liquid dairy products is 20 milliunits per liter (mU/L) phosphatase (~0.002% raw milk). This is much lower than the 350 mU/L level (0.1% raw milk) mandated by nearly all public health agencies.
The development of milk powders has revolutionized the dairy industry and allowed for a highly nutritional foodstuff to be exported safely around the world. Milk contains 85–90% water (Table 1); it is reduced by removing the water and can reduce the milk weight to 12% w/v, allowed for cheaper and easier transport. History tells us that in the thirteenth century, Marco Polo reported that soldiers of Kublai Khan carried sun-dried milk on their expeditions [57]. In 2013, the world’s largest dairy spray dryer was installed by Fonterra Dairy Co-Op in New Zealand that has a capacity to produce 30 tons of milk powder per hour, converting four and a half million liters of fresh milk each day [58]. Three years later, in 2016, a “second of its kind,” world’s largest spray dryer started production at another Fonterra milk powder plant, which illustrates that, the trend is toward maximized production of dairy powders.
Milk powders can include whole milk powder (WMP), skim milk powder (SMP), fat filled milk powder (FFMP), infant formula, and milk protein concentrate, which is 85% pure milk protein. Its uses include in bakery, confectionary, ice cream, and in fermented food such as yogurt. Many are advertised as nutritional supplements and are fortified with vitamins, folic acid, and iron.
4.1. Evaporation and drying
Milk powder is manufactured by spray-drying precondensed milk. A falling film evaporator is commonly used in the dairy industry to concentrate the milk from ~13% total solids (TS) to a target of up to 52%. Evaporation is simply the removal of a solvent from a solution or slurry. Milk itself is defined as a colloid with the solvent being the water. Other methods of removing water can include freeze-drying [59]. The constituents of milk can be seen in Table 1. As some products are sensitive to heat, the design of evaporators with respect to temperature and holding time is vital in order to achieve the desired effects on the one hand, but without causing heat damage and denaturation to the milk proteins. To minimize the thermal impact on the products from the heat applied, evaporation takes place in a vacuum at pressures of 160–320 hPa, equivalent to water boiling temperatures of 55–70°C. Energy efficiency is the main driving force in improved design and technologies in evaporation [60, 61]. Inside the evaporator are a bundle of tubes for the exchange of heat and these are enclosed in another steel cylinder, in evaporation parlance called a “calandria.” The vaporized solvent is cooled to condensate, which is then removed. It can go to storage, be recirculated, recovered for heat transfer, or filtrated but this is secondary to the evaporation process itself. The main unit of an evaporator is called an “effect.” Generally, more than one “effect” is used, to increase efficiency by using the heat from the vapor from the previous “effect” to heat the feed in the next. Steam economy is a term used to quantify how much original steam is used in ratio to vapor steam. If 1 Kg of steam produces 1 Kg of vapor in a single “effect” system, 1 Kg of steam will produce ~2 Kg of vapor in a two “effect” system. The specific steam consumption of the former is 100%, while it is 50% in the latter case. This cuts down the cost of generating original steam feed. A subsequent “effect” must have a lower pressure than the previous “effect,” and a step-wise vacuum is applied to the whole evaporation process to achieve this. There are three main elements in evaporation: heat transfer, vapor-liquid separation, and energy efficiency [62].
When milk leaves the evaporator (Figure 1), it is passed through the spray dryer through small nozzles, which make small droplets or atomizing the liquid, the smaller the better. The drying chamber has a temperature of 160–205°C, the droplets are swirled around (1 l of concentrate is atomized to 1.2 × 10¹¹ droplets with a diameter of 50 micron with a total surface of 120 m2.). For effective drying, the air should be hot, dry (low humidity) and moving. The powder falls to the bottom where it is collected in a “fluid” bed under the cone of the drying chamber, where fine powder behave in an analogous manner to a liquid and it can be conveyed without forming clusters. Fluid beds permit mild second stage drying and cooling of delicate products. Agglomeration changes the bulk density of the product [12].
The bulk density of the powder can dictate how the milk powder dissolves in hot beverages including for tea, coffee, and chocolate. The particle size of the milk powders determines its reconstitution properties. Powders consisting of particles of <100 μm are difficult to wet with water and form lumps [63], in the case of full-fat milk powder (FFMP), which is difficult to wet, it is sprayed with lecithin or oils (e.g., palm) to improve reconstitution characteristics. The standard method for measuring bulk density is ISO 8966:2005 [64].
Milk powders can be classified accordingly to the heat treatment they receive. There are five levels of heat classification: ultra-low (<70°C/15 s) common low (70°C/15 s), medium (85–90°C/20–30 s), high (110–135°C/30 s), and high-heat stable (~135°C/30 s). The whey protein nitrogen index (WPNI) expresses the content of un-denatured whey protein (mg WPNI per gram of powder) and demonstrates the severity of the heat treatment. Low-heat WPNI >6.0 mg, while high-heat WPNI is <1.5 mg, values are expected [65]. An alternative heat classification of milk powder is by casein number (CN—total nitrogen precipitated at pH 4.7), this measure was introduced as the protein concentration in milk changes with the seasons and feeding patterns [66]. The CN number is not linked to the overall protein content of the milk. The CN value of high quality raw milk is in the range 80–82, expressed in percentages. The CN values in excess of 82 indicate that the denaturation of whey protein has taken place. Completely denatured milk has a CN value of 92.
The composition of and additives allowed in milk powders are regulated by the Codex Alimentarius Commission—Milk and Milk Products [67, 68]. The Codex standard stipulates that only milk and cream may be allowed in milk powders; though the protein content can be altered by adding lactose. Milk proteins include casein complexes and whey protein fractions. Casein is the most abundant with whey proteins in lower concentrations. The casein concentration in cow milk is 2.46–2.80/100 g and whey proteins in the range 0.55–0.70/100 g. The composition of milks from various animal species is well reviewed in Barłowska et al. [69].
The moisture content of milk powder must be controlled during milk processing, as it is a factor in the long-term quality of the product, and it influences the cost of production. The method for determination of the moisture content includes the ISO 5537: 2004 reference method [70] and IDF Provisional Standard 26A:1993 [71] and EU commission Directive method (79/1067) [72]. A test portion of milk powder is dried at 102 ± 2°C until constant mass is obtained, but this measurement can be affected by the relative humidity of the air in the laboratory where the test is carried out. Rapid methods and newly designed equipment are always being introduced to avoid air humidity interference in the measurement and one new method is by using a microwave cavity perturbation technique [73].
Each step along the milk processing train can be contaminate by the air [74] and the water [75], used in the milk processing stages. Hygiene control at all stages, including hygienic design of the manufacturing equipment, is critically important.
5.1. Microbial quality analysis at farm level
The microbial quality of milk starts a farm level. Milk is sterile at secretion in the udder but is colonized by bacteria before it leaves the udder [76]. The temperature of milk expelled from the udder is approximately 35°C; to prevent microbial growth, rapid cooling, and storage to 4°C is necessary. The dairy farmer has the responsibility of managing and maintaining a clean and hygienic milking parlor with a good milking and storage routine. The farmer can detect early signs of mastitis infection by using a somatic cell count (SSC) test. Low levels of SCC (<200,000/ml) are wanted to guarantee good extraction of protein from milk. High levels of SCC also reduce other levels of milk constituent including lactose. The California Mastitis Test (CMT) offers a quick and easy on-farm test; the test does not provide a specific SCC, but will give a positive result once a cow’s SCC goes over 400,000 cells/mL. The addition of the CMT solution to milk samples with a high number of leukocytes/white blood cells causes the solution to become mucous like. This reaction is caused by the release of DNA from somatic cells, which are now higher due to the immune response of the cow to infections. Mastitis is caused by the microorganism Staphylococcus aureus. CMT test are available commercially from many companies.
The milk tanker driver can perform a few tests at the farm, but this is not often practical. The collector will also take a sample of raw milk and label it with a bar code identifier, to be brought back to the dairy processing plant. Composite samples are taken for the detection of inhibitory substances (e.g., antibiotics, antiseptics) to be tested later at the processing plant and if positive the individual suppliers samples are then analyzed.
5.2. Microbial quality testing at milk intake
At the milk intake point, the milk is tested before acceptance into the processing train. One such historic test described in 1929 [77, 78] is the Resazurin test, which determines the microbiological quality of the milk. The theory of this test is that Resazurin, a blue dye, is reduced in an oxidation-reduction reaction, as bacteria grow in the milk they use up oxygen and this can reduce the Resazurin dye to a pink color. All that is required is 10 ml of milk, 1 ml of resazurin solution (0.05%), mix well and incubate at 37°C for 2 min. The color changes from blue to mauve to purple to pink and lastly colorless and is compared to standardized color disks or measured in an instrument called a Comparator (developed by Lovibond, originally) which is a short path length instrument (up to 40 mm) for visually matching samples with relatively dark colors. A reading of ≥4, which is comparable to an estimate of a total bacterial count of 0.1–2 million cfu/ml, is a satisfactory milk quality result.
The milk density is another rapid test to determine adulteration of the milk and an indication for the deviations from the normal milk composition, for example, if it has been watered down or skimmed. In this test, a dipping lactodensimeter combined with a thermometer is used (Gerber instruments; Brouwland instruments), lactometers/milk hydrometers are calibrated in either grams per milliliter (g/cm3), degrees specific gravity (SG), or Degrees Quevenne. 1° Quevenne = 0.001°SG. Density ranges for standard milk are between 1.026 and 1.034 g/cm3. The adding of 10% water to milk will end up decreasing milk density by ~0.003 g/cm3.
A wide variety of bacteria grow and survive in milk, including problematic spore-forming bacteria [79] and pathogens such as nontyphoid Salmonella, Campylobacter, Listeria monocytogenes, and Shiga toxin-producing Escherichia coli are also found [80]. In addition, Cronobacter sakazakii has been found in milk powder producing plants and is a particular risk to infants [81].
The common bacteria in milk are lactic acid bacteria (LAB), which can produce enough acid to reduce the pH of milk, and cause the coagulation of proteins, thus fermenting the milk [82]. The density test as previously described should be introduced at milk intake, as it can determine the degree of LAB growth. LAB can be divided into rods (Lactobacillus and Carnobacterium) and cocci (all other genera).
Psychrotrophic microorganisms are also present up to 80% in fresh collected milk, they are able to grow quickly below 7°C, and some contain heat-stable enzymes, which cause spoilage, including many Gram-negative bacteria, such as Pseudomonas fluorescens, Pseudomonas fragi, Pseudomonas putida, Achromobacter, Aeromonas, Alcaligenes, Chromobacterium, Flavobacterium, Serratia, and Enterobacter [83].
Thermoduric bacteria can survive pasteurization. They do this by forming spores, which can then carry over into the final product. This can cause quality defects in milk products such as decreasing the shelf life of pasteurized milk. They are represented mainly by Gram-positive bacteria, e.g., Bacillus and Clostridium spp., and the nonspore-forming genera, e.g., Micrococcus, Streptococcus, and Corynebacterium. Levels of greater than 1000 cfu/ml are normally the result of poor cow hygiene and milking equipment (particularly in the case of ineffective hot wash routines). Potential sources of thermoduric bacteria include silage, faces, animal bedding, and soil [84]. Thermophilic bacteria grow in milk held at raised temperatures (55°C or higher), including pasteurization, 62.8°C, they include the Bacillus spp. Thermophilic bacteria are monitored by standard plate count methods with incubation at 55°C [85]. However, obligate thermophiles, such as Geobacillus stearothermophilus and Anoxybacillus flavithermus tend to grow to high numbers in milk powder manufacturing plants [86]. Although these microorganisms generally are not pathogenic, there is evidence to show that they cause human diseases [87], their growth results in high bacterial numbers and their presence can be interpreted as an indicator of poor plant hygiene. Spores of G. stearothermophilus are also able to survive ultra-high-temperature (UHT; 134–145°C for 1–10 s) treatment [88]. A recent study outlined the prevalence of contaminated milk processing samples with spore-forming bacteria, which increased from 23% on farm, to up to 58% post pasteurization stage [89].
The total viable count (TVC), or total bacterial count (TBC), is used to indicate the overall level of microorganism in milk; E. coli and coliforms to indicate any fecal contamination; and Pseudomonas spp., to indicate any nonfecal contamination. EU legislation, describing precise hygiene rules for foods from animal origins (amended in 2017) lays down comprehensive criteria for milk quality [90]. The ruling indicates that TBC in raw milk should be less than 100,000 cfu/ml; however, a TBC of less than 15,000 cfu/ml is desired. A standard to aim for is <1000 cfu/ml as milk leaves the udder; <3000 cfu/ml as milk leaves the milking machine; and <5000 cfu/ml in the bulk tank. Further contamination takes place during storage and preprocessing activities.
New technologies in the dairy industry are slowly integrating both at farm level and in the dairy processing plant. At farm level, the introduction of robotics such as automated milking parlors developed by Lely and introduced in 1992 by Delaval (Sweden). The cows enter the parlor without prompting and some cows are milked three times a day, with increased milk product for the farmer. The tags on the cows allow for integration into the machines which collect vast amounts of data, including number of steps, chewing the curd, etc. Robotic milking machines have a life span of approx. 13 years and then required further investment. Determination of when a cow is in heat for efficient reproduction is available with MooCow developed by Dairy Master (Ireland), together with MooMonitor to guide cows in the parlor. A separate company created MooCall, a sensor attached to the cow tail, which can monitor contractions during calf birth and send a SMS message to the farmer, the sensor can determine as close as 1 h to delivery [91]. Some of the more recent analytical instruments for milk analysis that has been introduced, but are not yet standard and include: Fourier transform MIR spectroscopy for milk-based quantitative, qualitative phenotypic and genomic analysis. Flow CYTOMETRY is a well-established technique for bacteria and somatic cells counting and differentiation [92], and companies making these include: Bentley (https://bentleyinstruments.com/), Foss (https://www.fossanalytics.com/en#) and Delta (http://www.deltainstruments.com/); ELISA (enzyme linked immunosorbent assay) for milk amyloid; milk amyloidA (MAA) biomarker is an early detection method for clinical and subclinical mastitis. MAA is the only acute phase protein produced in response to bacterial infection in the udder and is therefore an immediate and direct indicates of infection [93]. PCR (polymerase chain reaction) is used for bacteria identification and differentiation [94, 95]. Gas chromatography/mass spectrometry can be used for analysis for metabolomics characterization of milk [96, 97]. Liquid chromatography/electrospray ionization and mass spectroscopy can be used for the detection of peptides and glycopeptides. ICP-MS (Induction coupled plasma mass spectroscopy) for mineral and trace element analysis. Industry 4.0 technologies can be introduced at all stages of the plant manufacturing systems, including environment monitoring [98].
The milk processing chain demands accurate and quality products from farm to plate and for all of its products, e.g., fluid milk, milk powders, etc. It must start with the raw material at farm level including; dairy herd improvement testing, to payment parameters, and quality control of the raw milk. Optimization is important in the processing of milk in the dairy chain as 73 plus tests are carried out including chemical physical and microbiological tests, set against ISO standards, EU, USFDA regulations, and most countries internal regulations. Advances are slowly being made to have modern and optimized methodologies approved. The regulatory bodies are setting new standards from verified inter-laboratory studies, targeting the advancement in instrumentation and for at-line and in-line production analysis for improved predictability and control of manufacturing processes. The finished product must be safe and comply with regulatory requirements.
At a conference in Glasgow (Semex Dairy Conference, Jan 2018), it was questioned whether the dairy industry could cease to exist after approximately 10 years, due to the interest in vegan alternatives and the increased population who are lactose intolerant [99, 100]. A business model to address this alternative has resulted in a cow-free milk product called Perfect Day, an animal-free milk made by using yeast and fermentation techniques to produce a product with equivalent dairy proteins (http://www.perfectdayfoods.com/). It is unlikely that nondairy products will overtake real-natural product in the short term. Milk powders are still a big business and the optimization approach to change the paradigm from inspect and reject to predict and prevent is developing increased interest for the factory of the future [101], and is an approach that cannot be ignored. Regardless of developments, a quality milk product must be the result. There can be no food security without food safety.
1.Ahern J. Applying lean techniques to dairy farming. Acountance Plus. 2017;03(Sept):26-27
2.FAO-UN. Food and Drug Organisation of the United Nations [Internet]. 2017. Milk and Milk Products: Price and Trade Update Price Index. Available from: http://www.fao.org/3/a-i8326e.pdf [Accessed: April 3, 2018]
3.DeLoitte. The Global Dairy Sector—Trends and Opportunities [Internet]. 2017. Deloitte Development LLC. Available from: https://www2.deloitte.com/ie/en/pages/consumer-industrial-products/articles/global-dairy-trends-2017.html [Accessed: February 24, 2018]
4.FAO-UN. Global Dairy Sector: Facts. 2016. Food and Agriculture Organisation of the United Nations. Available from: https://www.fil-idf.org/wp-content/uploads/2016/12/FAO-Global-Facts-1.pdf [Accessed: February 24, 2018]
5.Deloitte. Capitalizing on the Shifting Consumer Food Value Equation [Internet]. 2015. Deloitte Development LLC. Available from: https://www2.deloitte.com/content/dam/Deloitte/us/Documents/consumer-business/us-fmi-gma-report.pdf [Accessed: February 24, 2018]
6.FAO-UN. Gateway to Dairy Production and Products [Internet]. 2018. Available from: http://www.fao.org/dairy-production-products/en/ [Accessed: June 9, 2018]
7.Eurostat. Milk and Milk Product Statistics [Internet]. 2018. Available from: http://ec.europa.eu/eurostat/statistics-explained/index.php/Milk_and_milk_product_statistics [Accessed: April 3, 2018]
8.Jenkins TC, McGuire MA. Major advances in nutrition: Impact of milk composition. Journal of Dairy Science. 2006;89:1302-1310
9.EU Council Regulations No. 1169/2011 of the European Parliament and of the Council of 25 October 2011. On the vision of food information to consumers. Official Journal of the European Union. 2011;L304:18-63
10.US-FDA. Grade “A” Pasteurized Milk 2015 Revision U.S. Department of Health and Human Services, Public Health Service, Food and Drug Administration [Internet]. Available from: https://www.fda.gov/downloads/Food/GuidanceRegulation/GuidanceDocumentsRegulatoryInformation/Milk/UCM513508.pdf
11.Tetra Pak. The Chemistry of Milk. Chapter 2. In: Dairy Processing Handbook: Tehnology, Engineering, Agriculture [Internet]. 2015. Ch2. Tetra Pak International. Available from: http://dairyprocessinghandbook.com/chapter/chemistry-milk [Accessed: May 21, 2018]
12.Tetra Pak. Milk and Whey Powder. In: Dairy Processing Handbook: Technology, Engineering, Agriculture [Internet]. 2015. Tetra Pak International. Ch17. Available from: http://dairyprocessinghandbook.com/chapter/milk-and-whey-powder [Accessed: May 21, 2018]
13.FAO-UN. Livestock Solutions for Climate Change [Internet]. 2017. Food and Agriculture Organisation of the United Nations. Available from: http://www.fao.org/3/a-i8098e.pdf [Accessed: June 9, 2018]
14.Safefood. Impact of Climate Change on Dairy Productoin [Internet]. 2017. Safefood, Little Island, Ireland. Available from: http://www.safefood.eu/Publications/Research-reports/The-impact-of-climate-change-on-dairy-production.aspx [Accessed: May 22, 2018]
15.Flores-Flores ME, Lizarraga E, López de Cerain A, González-Peñas E. Presence of mycotoxins in animal milk: A review. Food Control. 2015;53:163-176
16.EPA. US Environmental Protection Agency. Technical Fact Sheet—Perchlorate [Internet]. 2014. Available from: https://www.epa.gov/sites/production/files/2014-03/documents/ffrrofactsheet_contaminant_perchlorate_january2014_final.pdf
17.Leung AM, Pearce EN, Braverman LE. Perchlorate, iodine and the thyroid. Best Practice & Research. Clinical Endocrinology & Metabolism. 2010;24(1):133-141. DOI: 10.1016/j.beem.2009.08.009
18.ISO/TC34/SC5. Milk and Milk Products, (Calalogue of Standards). Geneva, Switzerland: International Organization for Standardization; 2018
19.ISO 6091. Dried Milk. Determination of Titratable Acidity (Reference Method). Geneva, Switzerland: International Organization for Standardization; 2010
20.ISO 26844. Milk and Milk Products. Determination of Antimicrobial Residues. Tube Diffusion Test. Geneva, Switzerland: International Organization for Standardization; 2006
21.ISO 5764. Milk—Determination of Freezing Point—Thermistor Cryoscopy Method (Reference Method). Geneva, Switzerland: International Organization for Standardization; 2009
22.ISO 1736. Dried Milk and Dried Milk Products. Determination of Fat Content. Gravimetric Method (Reference Method). Geneva, Switzerland: International Organization for Standardization; 2008
23.ISO 8968-1. Milk and Milk Products. Determination of Nitrogen Content—Part 1: Kjeldahl Principle and Crude Protein Calculation. Geneva, Switzerland: International Organization for Standardization; 2014
24.ISO 14891. Milk and Milk Products. Determination of Nitrogen Content. Routine Method by Combustion According to the Dumas Principle. Geneva, Switzerland: International Organization for Standardization; 2002
25.ISO 22662. Milk and Milk Products. Determination of Lactose Content by High Preformance Liquid Chromatography (Reference Method). Geneva, Switzerland: International Organization for Standardization; 2007
26.van der Have AJ, Deen JR, Mulder H. The composition of cow’s milk. 4. The calculation of the titratable acidity studied with separate milkings of individual cows. Netherlands Milk and Dairy Journal. 1979;33:164-171
27.EU Council Regulation (EEC) No 2377/90 of 26 June 1990. Laying down a community ‘procedure for the establishment of maximum residue limits of veterinary medicinal products in foodstuffs of animal origin’. Official Journal of the European Union. 1990;L224:1-136
28.Codex CAC/MRL 2-2015. Maximum Residue Limis (MRL’s) and Riskmanagement Recommendatins (RMM’s) for Residues of Veterinary Drugs in Foods. Rome: Codex Alimentarius World Health Organisation, Food and Agriculture Organisation of the United Nations (FAO/WHO); 2015
29.Adley CC, Dowling A, Handschue H, Ryan MP. Emerging policy on antibiotic resistance, the consumption of antimicrobial agents and occurrence of antimicrobial resistance in bacteria from humans and food producing animals. In: Mendez-Vilas A, editor. The Battle against Microbial Pathogens, Basic Science, Technological Advances and Educational Programs. Microbiology Book Series 5. Vol. 2. Badajoz: Formatex Research Centre; 2015. pp. 913-922
30.Zamberlin Š, Antunac N, Havranek J, Samaržija D. Mineral elements in milk and dairy products. Mljekarstvo/Dairy. 2012;62(2):111-125
32.Parodi P. Milk fat in human nutrition. Australian Journal of Dairy Technology. 2004;59:3-59
33.Shingfield KJ, Reynolds CK, Hervas G, Griinari JM, Grandison AS, Beever DE. Examination of the persistency of milk fatty acid composition responses to fish oil and sunflower oil in the diet of dairy cows. Journal of Dairy Science. 2006;89(2):714-732
34.Ranjan A, Sahoo B, Singh VK, Singh SP. Effect of rumen protected fat supplementation on nutrient utilization and production performance of lactating buffaloes. Animal Nutrition and Feed Technology. 2013;13:205-2014
35.Pitta DW, Indugu N, Vecchiarelli B, Rico DE, Harvatine KJ. Alterations in ruminal bacterial populations at induction and recovery from diet-induced milk fat depression in dairy cows. Journal of Dairy Science. 2018;10(1):295-309
36.James CS. Experiment procedures—Estimation of major food constitutions. In: Analytical Chemistry of Foods. Chapter 5. Heidelberg: Springer; 1994. pp. 71-135
37.Brandão MCMP, Carmo AP, Bell MJV, Anjos VC. Characterization of milk by infrared spectroscopy. Review Instituto de Laticinios‘Cândido Tostes’. 2010;65(373):30-33
38.Meagher LP, Holroyd SE, Illingworth D, van de Ven F, Lane S. At-line near-infrared spectroscopy for prediction of the solid fat content of milk fat from New Zealand butter. Journal of Agricultural and Food Chemistry. 2007;55(8):2791-2796. DOI: 10.1021/jf063215m
39.ISO 9622. Milk and liquid milk products. In: Guidelines for the Application of Mid Infared Spectrometry. Geneva, Switzerland: International Organization for Standardization; 2013
40.IDF. Protein Determination. International Dairy Federation Fact Sheet [Internet]. 2013. Available from: https://www.fil-idf.org/wp-content/uploads/2016/04/Protein-Determination.pdf [Accessed: May 20, 2018]
41.Gésan-Guiziou G. Removal of bacteria, spores and somatic cells from milk by centrifugation and microfiltration techniques. In: Griffiths MW, editor. Improving the Safety and Quality of Milk: Milk Production and Processing. Cambridge: Woodhead Publishing; 2010. pp. 349-372
42.Doyle MP, Glass KA, Beery JT, Garcia GA, Pollard DJ, Schultz RD. Survival of Listeria monocytogenes in milk during high-temperature, short-time pasteurization. Applied and Environmental Microbiology. 1987;53(7):1433-1438
43.Smeets E, Kooman J, van der Sander F, Stobberingh E, Frederik P, Claessens P, Grave W, Schot A, Leunissen K. Prevention of biofilm formation in dialyssis water treatment systems. Kidney International. 2003;63:1574-1576
44.Kananeh AB, Peschel J. Fouling in plate heat exchangers: Some practical experience. In: Mitrovic J, editor. Heat Exchangers—Basics Design Applications. Chapter 20. Croatia: InTech. Available from: http:www.intechopen.com/books/heat-exchangers-basics-design-applications/fouling-in-plate-heat-exchanges-some-practical-experience
45.Bird J. Milk standardisation. International Journal of Dairy Technology. 1993;46(2):35-37
46.Holsomger VH, Rajkowski KT, Stabel JR. Milk pasteurisation and safety; brief history and update. Review Scientific and Technical Review of the Office International des Epizooties (Paris). 1997, 1997;16(2):441-451
47.Enright JB, Sadler W, Thomas RC. Pasteurization of milk containing the organism of Q fever. American Journal of Public Health. 1957;47:695-700
48.Pexara A, Solomakos N, Govaris A. Q fever and prevalence of Coxiella burnetii in milk. Trends in Food Science & Technology. 2018;71:65-72
49.US–FDA. United States Food and Drug association. Food Facts. The Dangers of Raw Milk. Center for Food Safety and Applied Nutrition Food [Internet]. 2012. Available from: https://www.fda.gov/downloads/Food/FoodborneIllnessContaminants/UCM239493.pdf [Accessed: May 17, 2018]
50.Gorman R, Adley CC. Characterisation of Salmonella enterica serotype Typhimurium isolates from human, food and animal sources in the Republic of Ireland. Journal of Clinical Microbiology. 2004;42(5):2314-2316
51.USDA-FSIS. Salmonella Typhimurium DT104 Situation Assessment (Review of Information as of December, 1997) [Internet]. United Stated Departmentof Agricultuer and Food Safety and Inspection Services. Available from: https://www.aphis.usda.gov/animal_health/emergingissues/downloads/dt104.pdf [Accessed: May 19, 2018]
52.EU-ECDC. European Union summary report on trends and sources of zoonoses, zoonotic agents and food-borne outbreaks in 2016. European Food Safety Association Journal. 2017;15(12):5077. (228 pages)
53.Adley CC, Dillon C. Listeriosis, salmonellosis and verocytoxigenic E. coli: significance and contamination in processed meats. In: Kerry JP, Kerry JF, editors. Processed Meats: Improving Safety, Nutrition and Quality. Chapter 4. Oxford: Woodhead Publishing Ltd; 2011. pp. 72-108
54.Olsen SJ, Ying M, Davis MF, Deasy M, Holland B, Iampietro L, et al. Multidrug-resistant Salmonella typhimurium infection from milk contaminated after pasteurization. Emerging Infectious Diseases. 2014;10(5):932-935. DOI: 10.3201/eid1005.030484
55.Murphy S, Martin NH, Barbano DM, Wiedmann M. Influence of raw milk quality on processed dairy products: How do raw milk quality test results relate to product quality and yield? Journal of Dairy Science. 2016;99(12):10128-10147
56.Albillos SM, Reddy R, Salters R. Evaluation of alkaline phosphatase detection in dairy products using a modified rapid chemiluminescent method and official methods. Journal of Food Protection. 2011;74(7):1144-1154
57.Yule H. Concerning the tartar customsof war. In: The Book of Ser Marco Polo, the Venetian; Concerning the Kingdoms and Marvels of the East. Book 1, Ch LIV, 260-266. Translated by Sir Henry Yule. 3rd ed. London: John Murray; 1903
58.GEA. GEA group Aktiengesellschaft [Internet]. 2014. Building the World’s Largest Spray Dryer. Available from: https://www.gea.com/en/stories/building-the-worlds-largest-dairy-spray-dryer.jsp [Accessed: May 21, 2018]
59.Sánchez J, Hernández E, Auleda JM, Raventós M. Freeze concentration technology applied to dairy products. Food Science and Technology International. 2011;17(1):5-13
60.Moejes SN, van Boxtel AJB. Energy saving potential of emerging technologies in milk powder production. Trends in Food Science and Technology. 2017;60:31-42
61.Tetra Pak. Centrifugal seperators and milk standardisation. In: Dairy Processing Handbook: Tehnology, Engineering, Agriculture [Internet]. 2015. Tetra Pak International. Ch 6.2. Available from: https://www.tetrapak.com/about/tetra-pak-dairy-processing-handbook [Accessed: May 21, 2018]
62.Minton PE. Evaporator elements. In: Handbook of Evaporation Technology. New Jersey: Noyes; 1986. p. 5
63.Tuohy JJ. Some physical properties of milk powders. Irish Journal of Food Science and Technology. 1989;13(2):141-152
64.ISO 8967. Dried Milk and Dried Milk Products. Determination of Bulk Density. Geneva, Switzerland: International Organization for Standardization; 2005
65.Tetra Pak. Recombined milk products. In: Dairy Processing Handbook: Tehnology, Engineering, Agriculture [Internet]. 2015. Tetra Pak International. Ch 18. Available from: http://dairyprocessinghandbook.com/chapter/recombined-milk-products chapter 18 [Accessed: May 21, 2018]
66.Sweetsur AWM. The stability of instantizeo skimmed milk powder to hot coffee. International Journal of Dairy Technology. 1976;29(3):157-160
67.Codex. Codex standard 207-1999 for Milk Powders and Cream Powder. Rome: Codex Alimentarius World Health Organisation, Food and Agriculture Organisation of the United Nations (FAO/WHO); 1999
68.Codex, editor. Milk and Milk Products. 2nd ed. Rome: Codex Alimentarius World Health Organisation, Food and Agriculture Organisation of the United Nations (FAO/WHO); 2011. Available from: http://www.fao.org/docrep/015/i2085e/i2085e00.pdf
69.Barłowska J, Szwajkowska M, Litwińczuk Z, Krόl J. Nutritional value and technological suitability of milk from various animal species used for dairy production. Comprehensive Reviews in Food Science and Food Safety. 2011;10:291-301
70.ISO 5537. Dried Milk. Determination of Moisture Content (Reference Method). Geneva, Switzerland: International Organization for Standardization; 2004
71.IDF. Dried Milk and Cream—Determination of the Water Content of Dried Milk and Cream. Provisional Standard 26A. Brussels: International Dairy Federation; 1993
72.EU First Commission Directive of 13 November 1979. Laying down Community ‘methods of analysis for testing certain partly or wholly dehydrated preserved milk for human consumption’ (79/1067/EEC). Official Journal of the European Union. 1979;L327:29-53. (p 34)
73.Yang J, Huang M, Peng J, Shi J. Rapid determination of the moisture content of milk powder by microwave sensor. Measurement. 2016;87:83-86
74.Zacharski KA, Ryan A, Southern M, Adley CC. Examination of the microbiological status of air and surfaces in a dairy plant environment. Journal of Food Protection. 2018;81(7):1108-1116
75.Burke N, O'Dwyer J, Southern M, Adley CC. An analysis of the microbial quality of water in a milk production plant. LWT - Food Science and Technology. 2017;78:41-46
76.Evans AC. The bacteria of milk freshly drawn from the normal udders. The Journal of Infectious Diseases. 2016;18(5):437-476
77.Pesch KL, Simmert U. Combined assays for lactose and galactose by enzymatic reactions. In: Grimmer WE, editor. Dairying. Milchwirtschaftliche Forschungen. Vol. 8. Berlin: Springer; 1929. p. 551
78.Silanikove N, Shapiro F. Combined assays for lactose and galactose by enzymatic reactions. In: Preedy VR, editor. Food and Nutritional Components in Focus No 3: Dietary Sugars: Chemistry, Analysis, Function and Effects. Chapter 23. London: Royal Society for Chemistry; 2012. pp. 395-404
79.Pereira APM, Sant’Ana AS. Diversity and fate of spore forming bacteria in cocoa powder, milk powder, starch and sugar during processing: A review. Trends in Food Science and Technology. 2018;76:101-118
80.Adley CC, Ryan MP. The nature and extent of foodborne disease. In: Barros-Velázquez J, editor. Antimicrobial Food Packaging. Ch1. San Diego: Academic Press; 2016. pp. 1-10
81.Jacobs C, Braun P, Hammer P. Reservoir and routes of Enterobacter sakazakii (Cronobacter spp.) in a milk powder-producing plant. Journal of Dairy Science. 2011;94(8):3801-3810
82.Tsakalidou E, LML N. In: Toldrá F, editor. Handbook of Dairy Foods Analysis. Boca Raton: CRC Press; 2009. pp. 647-664
83.Sørhaug T, Stepaniak L. Psychrotrophs and their enzymes in milk and dairy products: Quality aspects. Trends in Food Science and Technology. 1997;8(2):35-41
84.Khanal SN, Anand S, Muthukumarappan K, Huegli M. Inactivation of thermoduric aerobic spore formers in milk by ultrasonication. Food Control. 2014;37:232-239
85.Burgess SA, Flint SH, Lindsay D. Characterization of thermophilic bacilli from a milk powder processing plant. Journal of Applied Microbiology. 2014;11:350-359
86.Scott SA, Brooks JD, Rakonjac J, Walker KMR, Flint SH. The formation of thermophilic spores during the manufacture of whole milk powder. International Journal of Dairy Technology. 2007;60:109-117
87.Rabkin CS, Galaid EI, Hollis DG, Weaver RE, Dees SB, Kai A, Moss CW, Sandhu KK, Broome CV. Thermophilic bacteria: A new cause of human disease. Journal of Clinical Microbiology. 1985;21(4):553-557
88.Hill BM, Smythe BW. Endospores of thermophilic bacteria in ingredient milk powders and their significance to the manufacture of sterilized milk products: An industrial perspective. Food Reviews International. 2012;28(3):299-312
89.Ortuzar J, Martinez B, Bianchini A, Stratton J, Rupnow J, Wang B. Quantifying changes in spore-forming bacteria contamination along the milk production chain from farm to packaged pasteurized milk using systematic review and meta-analysis. Food Control. 2018;86:319-331
90.EU Council Regulation No. 853/2004 of the European Parliment and of the Council of 29 April 2004. Laying down ‘specific hygienee rules for food of animal origin’. Official Journal of the European Union. 2004;L139:55. Last Amended in 2017;L285:10
91.Kegan M. Connected Cows: A Game Changer in the Dairy Industry [Internet]. 2018. Available from: https://www.ptc.com/en/product-lifecycle-report/connected-cows-a-game-hanger-in-the-dairy-industry [Accessed: February 26, 2018]
92.Li N, Richoux R, Perruchot MH, Boutinaud M, Mayol JF, Gagnaire V. Flow cytometry approach to quantify the viability of milk somatic cell counts after various physico-chemical treatments. PLoS One. 2015;10(12):e0146071. DOI: 10.1371/journal.pone.0146071
93.Miglio A, Moscati L, Fruganti G, Pela M, Scoccia E, Valoani A, Maresca C. Use of milk amyloid A in the diagnosis of subclinical mastitis in dairy ewes. Journal of Dairy Research. 2013;80(4):496-502
94.Oliwa-Stasiak K, Kolaj-Robin O, Adley CC. Development of real-time PCR assays for detection and quantification of the Bacillus cereus group sp: Differentiation of B. pseudomycoides and B. weihenstephanensis from species with non rhizoid growth isolated from milk. Applied and Environmental Microbiology. 2011;77(1):80-88
95.Oliwa-Stasiak K, Molnar C, Arshak K, Baroszcze M, Adley CC. Development of a PCR assay for identification of the Bacillus cereus group species. Journal of Applied Microbiology. 2010;108(1):266-273
96.Scano P, Murqia A, Pirisi FM, Caboni P. A gas chromatography-mass spectrometry-based metabolomic approach for the characterization of goat milk compared with cow milk. Journal of Dairy Science. 2014;97(10):6057-6066
97.Dallas DC, Lee H, Le Parc A, de Moura-Bell JMN, Barile D. Coupling mass spectrometry-based “Omic” sciences with bioguided processing to unravel milk’s hidden bioactivities. Advances in Dairy Research. 2013;1(2):1-9
98.Zacharski ZA, Southern M, Adley CC. Industry 4.0 vision considerations in a quality control sampling regime in a diary manufacturing plant. In: Proceedings of the 33rd International Manufacturing Conference (IMC33); 31 August–1 September 2016. Ireland: University of Limerick
99.Pevreall K. ‘Perfect’ high protein vegan diet created with out use of cows [Internet]. 2017. Livekindly. Available from: www.livekindly.co/vega-milk-protein/ [Accesssed: June 19, 2018]
100.Silanikove N, Leitner G, Merin U. The Interrelationships between lactose intolerance and the modern dairy industry: Global perspectives in evolutional and historical backgrounds. Nutrients. 2015;7:7312-7331
101.Petrusich J. Leveraging Big Data in Real Time: Changing the Paradigm from Inspect and Reject to Predict and Prevent [Internet]. 2014. InTech Magazine. Available from: https://www.scribd.com/document/228808622/Intech-Marabr-2014
Written By
Niamh Burke, Krzysztof A. Zacharski, Mark Southern, Paul Hogan,
Michael P. Ryan and Catherine C. Adley
Submitted: February 15th, 2018Reviewed: July 19th, 2018Published: November 5th, 2018