Open Access is an initiative that aims to make scientific research freely available to all. To date our community has made over 100 million downloads. It’s based on principles of collaboration, unobstructed discovery, and, most importantly, scientific progression. As PhD students, we found it difficult to access the research we needed, so we decided to create a new Open Access publisher that levels the playing field for scientists across the world. How? By making research easy to access, and puts the academic needs of the researchers before the business interests of publishers.
We are a community of more than 103,000 authors and editors from 3,291 institutions spanning 160 countries, including Nobel Prize winners and some of the world’s most-cited researchers. Publishing on IntechOpen allows authors to earn citations and find new collaborators, meaning more people see your work not only from your own field of study, but from other related fields too.
China has a huge undeveloped potential in the field of renewable energy and represents the highest nation in hydropower both in installation and generation worldwide with which contributes greatly in their energy supply and helps in elimination energy demand situation in the country to direct the energy system toward the area of sustainably, clean, and quality energy supply for its safety in the country. The manuscript discusses the current renewable energy systems in China, the potentials for various renewable energy sources, and way forward. It also discusses the expected state of renewable energy in the next four decades in China and the various strategic development techniques. The current renewable energy situations, both demand and supply situations, have been discussed. Summary of the approaches for new development by the various energy sectors in the country as well as support of the government in renewable energies has been analyzed.
School of Management Science and Engineering, Jiangsu University, China
Ransford O. Darko*
Department of Agricultural University, University of Cape Coast, Ghana
Boamah Kofi Baah
University of Professional Studies, Ghana
Agnes Abbey
Department of Renewable Energy, Cape Coast Technical University, Ghana
*Address all correspondence to: adudaniel39@yahoo.com and chiefrodark@yahoo.com
1. Introduction
With the advent of renewable energy and high investment risk, the main financial support areas of R & D activities for commercial applications are REPG [1], among the significant financial support for the Chinese government’s special funds for renewable energy, for the development of renewable energy-related activities, including resource exploration, and the development of standards, as well as the development of the project [2]. A small number of specific regulations were allotted for the special fund. For example, the Operation Views on Promoting the Development of Wind Power Generation Industry in 2006 was released by NDRC and MOF. It specified that the government would select several competent wind turbine and component manufacturers in which the R&D and testing of new products could be supported by the Renewable Energy Development Special Fund [3]. In the same way, appropriate laws and regulations also specified that the R&D of new products, as well as site industrialization of key technologies in the solar power industry, will be supported by a portion of the special fund [4, 5]. In addition to the special funds for the development of renewable energy, the government of China has as well provided R&D funds for renewable energy through the following plans and programs, for example, The National Basic Research Program of China (“973” Program), The “Five-year Plans,” and The National Natural Science Fund and The National High Technology Research and Development Program of China (“863” Program), [6]. Similarly, Liu et al., on the other hand, have divided China’s current renewable energy policy into several categories, including development planning, industry guidance and technical support, cost sharing, price incentives, legal responsibility, and promotion [7].
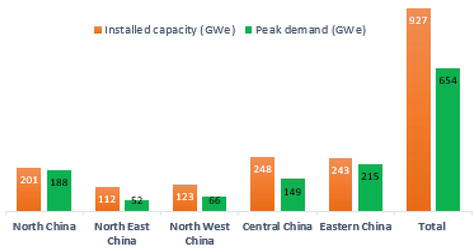
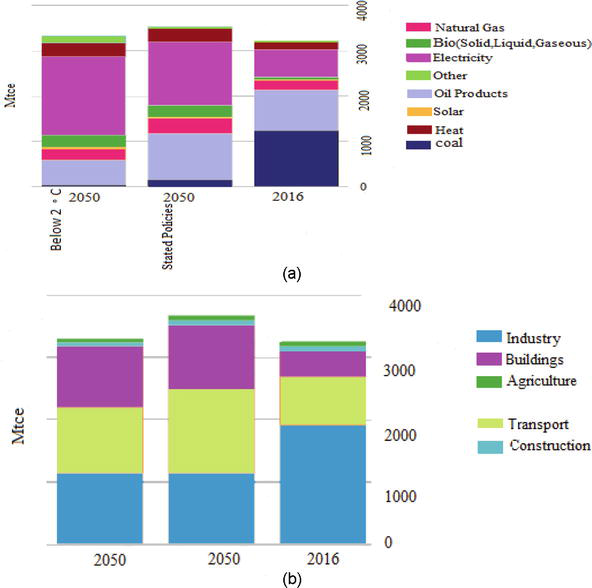
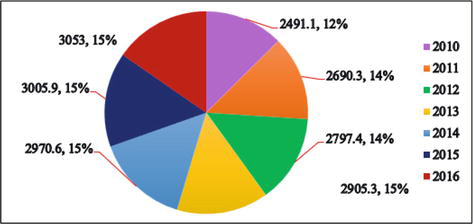
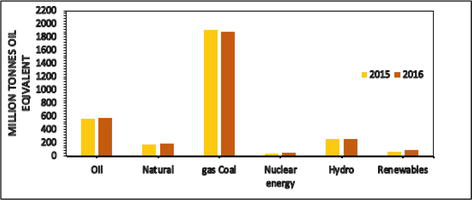
China’s energy demand is currently led by industrial sector, but there will be a drastic change in future. While total energy demand will remain as present in 2050, the structure will change. There will be a rise in the transport and building sectors energy consumption, while the industrial sector consumption will be reduced. Based on the policy report, the final energy demand is expected to reach 3397 Mtce by the year 2050 [8]. This rising demand can be resolved through renewable sources. This is true for both scenarios; nevertheless, the electrification and share of renewable energy are great in the Below 2°C Scenario. Here, 54% of energy demand will be electrical energy in 2050 in the scenario compared to 37% in the Stated Policies Scenario. Industrial area fossil energy use is mainly substituted by electricity. China is on the path to a greener and more diversified energy supply. The higher dependence on coal is removed and substituted with nonfossil energy sources. In both scenarios, the energy demand will peak around 2030, and by 2050 the Below 2°C Scenario will have an energy demand of 3202 Mtce [8]. Figure 1 shows the main energy installed capacity and peak demand in China by regions. Figure 2(a, b) shows the final energy demand (Mtce) in 2050 in the two scenarios compared with today, by sector and fuel type. There was an increase in total energy production from 627.7 million tce to 3600 between 1978 and 2014, with the consumption also rising by 5.69 times during the same period, attainment of 4260 million tce in 2014. Figure 3 shows China’s Primary Energy Consumption between 2010 and 2016. Figure 4 compares the energy consumption by source in China between 2010 and 2016 [8].
Figure 1.
The main energy installed capacity and peak demand in China by regions.
Figure 2.
Final energy demand (Mtce) in 2050 in the two scenarios compared with today, by sector and fuel type.
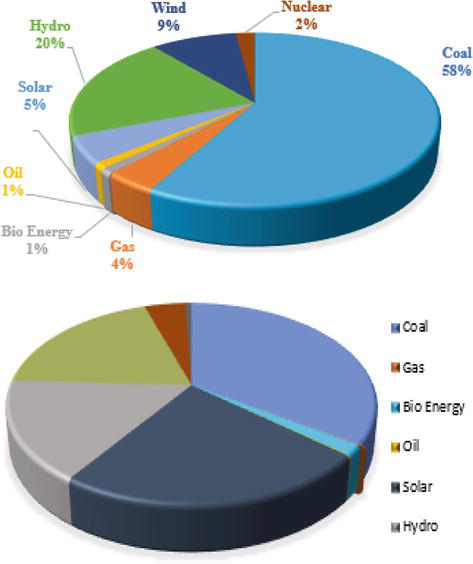
Figure 3.
China’s Primary Energy Consumption between 2010 and 2016. * Primary energy comprises commercially traded fuels, including modern renewables used to generate electricity. Notes: Oil consumption is measured in million tonnes; other fuels are measured in million tonnes of oil equivalent.
Figure 4.
China’s Primary Energy Consumption by fuel type between 2010 and 2016. * Primary energy comprises commercially traded fuels, including modern renewables used to generate electricity. Notes: Oil consumption is measured in million tonnes; other fuels are measured in million tonnes of oil equivalent.
As stated by Li Fulong, consumption of coal during the first half of 2017 was about 1.83 billion metric tons making 59.8% of the total energy. There was a rise of 3% in natural gas and nonfossil fuels mix to 29%. Based on the energy sector’s 5-year plan for 2016–2020, China targets to bring down the country’s share of coal energy mix down to less than 58%. China’s total energy consumption is expected to reach 5 billion tons by 2020, bringing about an annual increase of approximately 2.5% between 2016 and 2020. As stated by the plan, there will be an increase in the share of nonfossil fuels to over 15% with the share of natural gas also reaching 10% [9].
3. Current situation of renewable energy resources in China
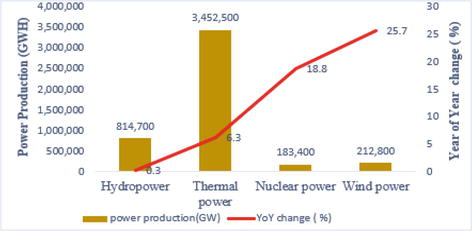
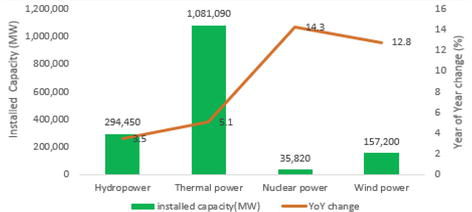
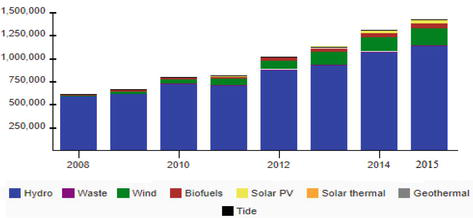
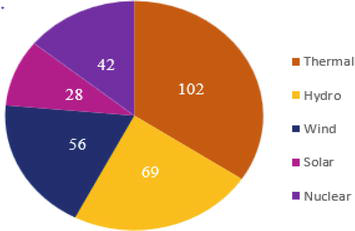
As stated by the 13th Five-Year Plan of China (between 2015 and 2020), energy from nonfossil was expected to constitute 15% of the entire main energy consumption during 2020. Based on the statistics of China’s energy council, China’s national total electricity consumption as on October 2017 was 513.0 billion kWh, an increase of 5.0% over the same period in 2016. The primary industry consumption was 8.4 billion kWh of electricity, an increase of 3.6%; the secondary industry consumption also was 365 billion kWh of electricity, an increase of 3.0%; tertiary industry consumption was 70.8 billion kWh of electricity, an increase of 12.4%; and urban and rural resident’s consumption was 68.8 billion kWh of electricity, an increase of 8.7%. All increased during the same time in 2016. The national installed capacity also reached 1.67 billion kW, and thus, 6000 kW and over power plants, an increase of 7.3% compared to 2016. Thus, hydropower was 300 million kW, thermal power was 1.08 billion kW, nuclear power was 35.82 million kW, and wind power was 160 million kW [10]. On the side of generation, the hydropower generation capacity reached 923.4 billion kWh within the first 10 months of 2017, an increase of 2.2% compared to the same time in 2016. Others like thermal power generation capacity reached 3799.3 billion kWh, an increase of 5.4%, nuclear power generation reached 203.6 billion kWh, an increase of 18.4, and wind power generating capacity reached 239.7 billion kilowatts, an increase of 25.3%. Figures 3 and 4 show the power production and installed capacity in the country as at the end of October 2017 with the year-on-year change in % [11] (Figures 5 and 6). Figure 7 shows Electricity Generation from Renewables in China by source, 2008–2015.
Figure 5.
Power production from renewables in China 2017. *Thermal includes coal, gas, oil, and biomass.
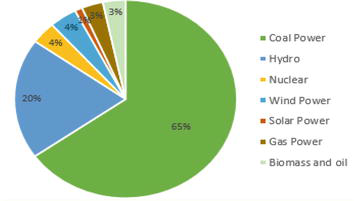
Figure 6.
Renewable energy installed capacity in China 2017. *Thermal includes coal, gas, oil, and biomass.
Figure 7.
Electricity Generation from Renewables in China by source, 2008–2015 (GWh) [12].
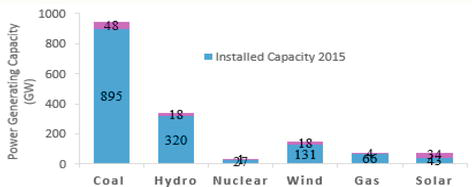
According to China’s electricity council, power system in China is still subjugated by coal; nevertheless, the 2016 additional installed capacity of solar power of 77 GW and wind power and solar power total of up to 149 GW brought about the higher portion of renewable installed capacity. Wind turbines generated 241 TWh of electricity in 2016, thus, an increase of 30% on that of 2015. Solar power generation also adds up by 72% with an increase in generation of 66TWh in 2016. Nuclear power stations also saw growth in 2016 compared to 2015 with a generation of additional 24% electricity reaching 213 TWh [13]. Figure 8 shows the installed power generating capacity in China together with the additions in 2016, while Figure 9 shows year-on-year growth in power production as Figure 10 shows the energy generation mix in the country 2016.
Figure 8.
The installed power generating capacity in China together with the additions in 2016 in GW [13].
Figure 9.
Year-on-year growth in power production (TWh) [13].
China has a huge undeveloped potential in the field of renewable energy, and the government has recently been aware of these resources and begun to take steps to take advantage of that potential. A study has shown that the country will be able to meet the emerging new demand if all the targets set by the government are achieved as it will yield new renewable energy generation capacity of 362 GW [15].
4.1 Hydropower
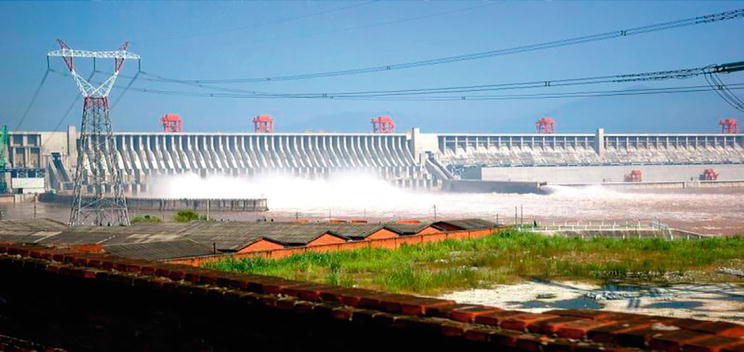
China leads globally in the field of hydropower installment capacity and generation. The country in 2016 saw growth in its overall installed hydro capacity of about 11.74 GW making a total of 330 GW [16]. China is the leading country of hydropower development in the world with the world’s leader in hydropower scale and project capacity development, with the largest hydropower station in the world’s situated along the Yangtze River. China had 117 GW of installed capacity in 2005 with the aforementioned of 300 GW by 2030. According to World Watch Institute, China has hydropower potential capacity of 500 GW [17]. The strong water resources in China are mainly in the western underdeveloped and along the east coast where electricity demand increases. Most of China’s water resources are in Sichuan, Tibet, and Yunnan, where the Yangtze River begin in Tibet and flows through Sichuan; the Pearl began in Yunnan [18]. China has greatly made a perfect use of the various most important channels in the country for hydroelectric development. Figure 3 shows The Three Gorges Dam, while Figure 4 shows the largest hydroelectric plants in China with their generation and installed capacity (Figure 11) [19].
Figure 11.
The Three Gorges Dam.
4.2 Wind
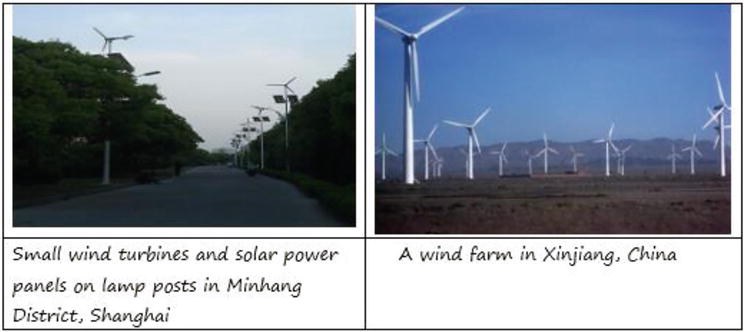
With hydropower, wind power has a great opportunity to become a major source of renewable energy in China. The Chinese government has developed a potential power generation capacity for the development of China’s wind power market, with its ability to increase its planned capacity by 2020 to generate 30 GW. China experienced a significant increase in energy from the wind farm throughout the country. [20]. The wind power industry in China has succeeded in rapid growth due to government intervention. China is a world leader in wind power generation, with the largest installed capacity of any nation [21] and continued rapid growth in new wind facilities [22]. In 2016, the country added 19.3 GW of wind power generation capacity [23] reaching a total capacity of 149 GW, [12] with an electricity generation of 241 TWh representing 4% of national total electricity consumption. China’s projection is to attain 250 GW of wind capacity by 2020 as part of government’s promise to produce 15% of all electricity from renewable resources [24]. The status of the base has been included in the policy and market with the development of tax incentives. In 2004, the Commission carried out a “wind power concession” for a 20-year work cycle to lessen the in-grid wind power tariff through the establishment of wind farms with high capacity [25]. Prior to 2006, the Commission agreed to construction of five large wind farms, all of having no less than 100 (MW) capacity [25]. As shown Figure 12. When the law of renewable energy was put into effect in 2006, the grid company was obliged to sign a grid connection agreement with the wind power generating company and purchase the full amount of the wind power generated by it [25]. Table 1 shows wind power installed capacity (MW) and generation (GWh) in China 2007–2016.
Figure 12.
Small wind turbines and solar power panels as well as wind farm in China.
2008
2009
2010
2011
2012
2013
2014
2015
2016
Capacity (MW)
12,200
16,000
31,100
62,700
75,000
91,424
114,763
129,700
149,000
Production (GWh)
3675
5710
14,800
26,900
44,622
74,100
103,000
134,900
153,400
Table 1.
Wind power installed capacity (MW) and generation (GWh) in China 2007–2016 [24].
4.3 Biomass power
Biomass is a multistep process of producing synthetic hydrocarbon fuels made from biomass that can be converted to both solid and liquid and gaseous fuels through chemical and biological processes [26]. Biomass is anticipated to contribute roughly between 15% and 50% of the world’s primary energy consumption by the year 2050 [27]. Biomass in China is a larger energy source than most would think because of the huge rural population. Eighty percent of biomass energy is located in rural China with the principal source being crop residue [28]. Approximately 4 billion tons of crop residues and wood fuels are burnt using stoves in the western rural areas [29] The Chinese government is making great strides to develop rural renewable energy, because biomass is a good already established one, and they are considering further development and efficiency gains in the use of traditional biomass. The government has begun to promote the development of biomass energy to achieve multiple projects at the national level. They participated in the planting and reforestation program in Wuhan, Guangdong Province. Over the past 14 years, the region has grown to 170.600 hectares with an increase in coverage from 31.5% to 49.4%, almost 20% of the increase in [29] and 62.8% increase in annual production capacity, and the increase can be repeated in other parts of the country. Due to the abundant domestic biomass resources, the biomass energy industry in China is rapidly developing [30].
4.4 Solar
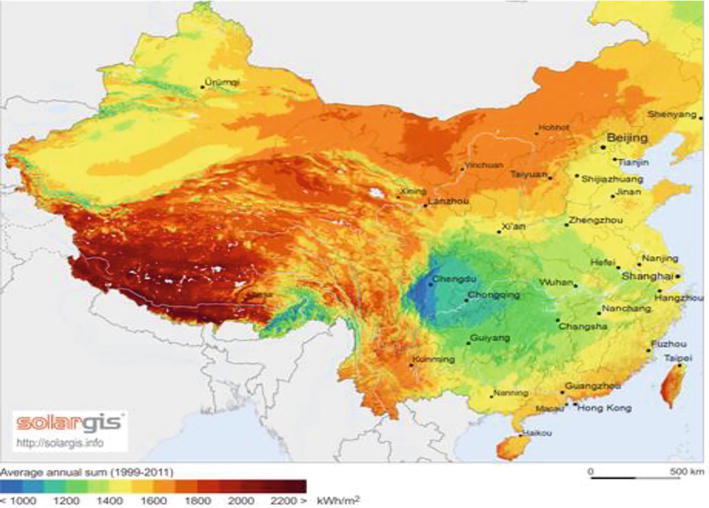
China is leading globally in terms of solar PVs installation since 2013 and leading the world’s largest market for both photovoltaics and solar thermal energy. It increased its total PV capacity to 77.4 GW [31] and was the first country to pass 100 GW of cumulative installed PV capacity in 2017 [32]. China currently has six factories that produce no less than 2 GW/year each of monocrystalline, polycrystalline, and noncrystalline photovoltaic cells. They comprise LDK Solar Co, Wuxi Suntech Solar Energy Co., Ltd. 50 MW/year of solar, Yunnan Semi-Conductor Parts Plant 2 MW/year of mono-crystalline cells, the Baoding Yingli Solar Energy Modules Plant, 6 MW/year of polycrystalline cells and modules, the Shanghai Jiaoda Guofei Solar Energy Battery Factory 1 MW/year of modules, and the Shanghai PV Science and Technology Co., Ltd. 5 MW/year of modules [32]. Figure 13 shows SolarGIS-Solar-map-China-Mainlands.
Figure 13.
SolarGIS-Solar-map-China-Mainlands.
Some of the technologies used as solar collectors and photovoltaic modules include the following: Molten Salt Storage Technology, the process uses inorganic salts to transfer energy generated by solar PV systems into solar thermal using heat transfer fluid rather than oils as some storage system have; and Solar Panel with Built-In Battery: with this application, the rechargeable battery is built into the solar panel itself, rather than operating as two stand-alone systems. According to scientists, conjoining the two into one system could lower costs by 25% compared to existing products.
5. Perspectives of renewable energy development in China
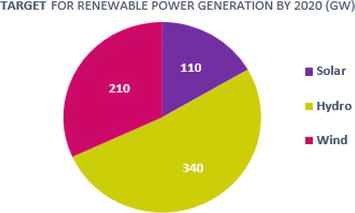
Studies are currently being conducted on other renewable energy sources, such as energy marine current energy, wave energy, ocean thermal energy, and salinity gradient energy, not forgetting tidal energy. Nevertheless, they are hardly ever being used for commercial power generation due to high cost, poor dependability, low efficacy, poor stability, and small size [33, 34]. The total accessible reserve of ocean energy resources in China is anticipated to be about 1000 GW with great potential for exploitation [35]. Figure 14 shows the Target for Renewable Energy Generation by 2020 and Table 2 also shows China’s New Policies Scenario Installed Capacity by Technology [36].
Figure 14.
Target for renewable energy generation by 2020 (GW).
Solar
Wind
Biomass
Hydro
Nuclear
Gas
Coal
2010
0
30
0
216
0
36
655
2016
77
149
0
332
34
67
945
2025
340
336
25
400
86
145
1061
2030
469
429
33
440
111
173
1089
2035
600
515
41
471
135
199
1096
2040
739
593
49
493
145
219
1087
Table 2.
China’s new policies scenarioi capacity by technology (GW).
5.1 Switching to a cleaner source of power
A good distribution and policy support helps to make renewables cheaper, and solar PVs turn out to be the cheapest form of energy generation in China.
Installed low-carbon capacity, led by hydropower, wind, and solar PV, raises quickly and constitutes 60% of total capacity by 2040. Average solar PV projects in China become cheaper than both new and existing gas-fired power plants around 2020 and cheaper than new coal-fired capacity and onshore wind by 2030 [37].
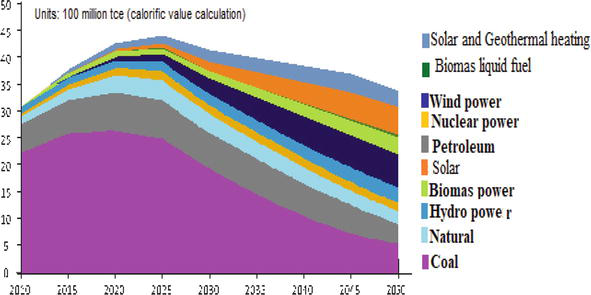
There was a rise of 1.3% in China’s energy consumption in 2016. Increase during these 2 years (2015 and 2016) has been the lowest aside 1997–1998. In spite of this, China continues to be the world’s largest growth market for energy within 16th successive years. Renewable power (without hydro) increased by 14.1% in 2016, beneath the 10-year average, but the largest rise on record (53 Mtce). The wind gave over half of renewables growth, while solar energy contributed almost a third despite accounting for only 18% of the total [2]. According to China’s energy agency, the country will cultivate $361 billion into renewable power generation by 2020 which will create over 13 million jobs in the sector. This is containing in the National Energy Administration (NEA) blueprint document which outlines their agenda for national energy sector development throughout their 5-year 2016 to 2020 period. The NEA also mentions that renewable power installed capacity including wind, hydro, solar, and nuclear power will constitute about half of new electricity generation by 2020 [38]. Figure 15 shows China’s Primary Energy Consumption by a source in the new portfolio (Figure 16).
Figure 15.
Installed power generation capacity in China in the New Policies Scenario 2040 of a total of 3188GW.
Figure 16.
China’s primary energy consumption.
Based on IRENA the global roadmap, renewable energy portion in China’s energy mix is anticipated to reach 17% by 2030 comparable to 13% in 2010. This analysis, however, displays that the country can convincingly achieve modern renewables to 26%. China can save over USD 200 billion a year by 2030, helping in the improvement of health and reducing CO2 emissions [39]. Under the high renewable energy penetration scenario, total power generation in China will be 15.2 trillion kWh in 2050. This consist of 1038 kW coal, 466 kW natural gas, 649 kW nuclear, 2187 kW hydro, 5350 kW wind, and 4130 kW of solar. All these energy resources were in billions. This, therefore, constitutes total of 85.8% of renewable energy power generation and 91% of nonfossil energy [40].
China has turned out to be the world leader in renewable energy and made a great investment. According to [41] report, China promised US$286 billion for the development of renewable energy as well as US$376 billion for energy conservation projects in 2011–2015. According to [42] report, the total investment of the world in 2015 was US$286 billion with China contributing 102.9 billion in 2015 as the world’s largest investor in the renewable energy development. China hosted over 25% of the world’s non-hydro renewable capacity as at the end of 2015, being 63.1 and 117.0% higher than the United States and Germany, correspondingly [43]. In 2006, China enacted the Renewable Energy Law and Pricing Law that implemented tax reduction, financial support, subsidy policies, and measures for renewable energy applications [37].
Summary of the renewable energy targets by the Research Committee of China has been tabulated in Table 3 (G1–G3) considering three cases comprising 2020, 2030, and 2050. The high uptake scenario would be a challenge to achieve. Nevertheless, there is a possibility of achieving it in realistic for China to achieve 45% of their energy from renewables to increase the county’s total energy consumption of 5.8 billion tce by 2050 (G4 in Table 3) [44].
Power generation capacity (GWe)
2020
2030
2050
G1
G2
G3
G4
G1
G2
G3
G4
G1
G2
G3
G4
Hydropower
310
340
370
350
403
430
453
400
440
510
530
530
Wind power
50
100
150
200
120
180
300
400
300
500
800
1000
Solar power
5
20
30
80
50
100
200
450
500
800
1000
1300
Geothermal power
0.08
0.08
0.08
0.5
0.5
0.5
0.5
5
1.5
1.5
1.5
50
Biomass power
15
20
30
30
20
20
20
35
10
10
10
35
Ocean power
0.04
0.04
0.04
0.1
1
1
1
1
10
10
10
10
Biogas
34.6
34.6
34.6
34.6
62.9
62.9
62.9
61
78.6
78.6
78.6
108
Biomass briquette
7.1
14.3
21.4
25
14.3
21.4
35.7
25
21.4
35.7
57.1
40
Geothermal
10.3
10.3
10.3
50
20.5
20.5
20.5
100
41
41
41
200
Ethanol/biodiesel
16.4
24.2
31.1
44.4
77.9
101.1
56.6
77.9
134.9
168.6
193
Total renewables (billion tce)
0.51
0.61
0.73
0.86
0.73
0.89
1.1
1.4
1.14
1.54
1.93
2.6
Total energy consumption (billion-tce)
4
4
4
4.6
4.5
4.5
4.5
5.5
5
5
5
5.8
Share of renewables (%)
12.7
15.3
18.2
18
16.3
19.8
24.4
25
22.8
30.8
38.5
45
Table 3.
China’s renewable energy development goals by 2050a.
This manuscript has discussed the various renewable resource potentials in China. It was revealed that hydroelectric power has the highest installed and development potential in the country with its development in most of the cities and provinces in the country. Other resources such as wind, solar, and biomass were also observed to have a great potential in the country which are yet to be developed. The various techniques to eliminate coal and fossil fuel use to overcome pollution and emission control by the government have also been discussed. This collaboration will continue to lead and guide the world toward further green development and make massive green supports for the welfare of people. The various Development Strategic Action Plan for and Instantaneous of renewable energy targets by the various Research Committees in the country have also been analyzed and suggested appropriate solutions for achievement.
The authors would like to express their gratitude to Mrs. Joyce Adu, Mrs. Joyce Oppong, Dr. Asare Bediako, Sam Adu-Kumi Jnr., and Majeed Usman Koranteg for their proof reading and correction. This work was supported by the Special Funds of the National Social Science fund of China, grant number 18VSJ038.
The authors have complied with ethical requirements: submission implies that, if accepted, it will not be published elsewhere in the same form, in English or in any other language, without the written consent of the publisher. The authors have no conflict of interest to declare.
Thank you for your consideration of the work.
References
1.Ouyang XL, Lin BQ. Levelized cost of electricity (LCOE) of renewable energies and required subsidies in China. Energy Policy. 2014;70:64e73
2.Ministry of Finance. National Development and Reform Commission, National Energy Administration (MOF/NDRC/NEA), Tentative procedures for the management of collecting and using renewable energy development special fund. January 2012
3.National Development and Reform Commission. Ministry of Finance (NDRC/MOF), implementation opinions on promoting the development of wind power generation industry. 2006.
4.Ministry of Finance (MOF). Tentative procedures for the management of special fund on the industrialization of wind power generating equipment. 2008.
5.Ministry of Finance. Ministry of Science and Technology, National Energy Administration (MOF/MOST/NEA), Notice on Implementing the Golden Sun Demonstration Project, July 2009
6.Zhao ZY, Zuo J, Fan LL, Zillante G. Impacts of renewable energy regulations on the structure of power generation in China e a critical analysis. Renewable Energy. 2011;36(1):24e30
7.Liu LQ , Liu CX, Wang JS. Deliberating on renewable and sustainable energy policies in China. Renewable and Sustainable Energy Reviews. 2013;17:191e198
8.BP Statistical Review of World Energy. June 2017. Available from: https://www.bp.com/content/dam/bp/en/corporate/pdf/energy-economics/statistical-review-2017/bp-statistical-review-of-world-energy-2017-full-report.pdf. [Accessed: 20 November 2017]
9.Li F. China’s energy structure continues to optimize. Available from: http://www.chinadaily.com.cn/business/2017-07/22/content_30211808.htm Accessed 20 December 2017
10.BP. BP Statistical Review of China. London: BP; 2016
11.CEC Sector Development and Environment and Resources Beijing, PR China. Available from: web@cec.org.cn
12.IEA – Report. 2015. Available from: www.iea.org. Retrieved 2017-09-23.
13.China Energy Portal. Tracking China’s transition to sustainable energy. February 27, 2017
14.CEC. National Power Industry Statistical Bulletin Data List. Beijing, PR China: Planning and Development Department; 2016
15.Zhang J, Adu D, et al. Review on China’s renewable energy and future Projections. International Journal of Smart Grid and Clean Energy. 2018;7(3):361-366
16.IHA. Key Trends in Hydropower. Chancery House, St Nicholas Way, Sutton, London: Central Office; 2017
17.Thompson R. China: Clean and Renewable Energy Report to. 2010
18.Yang JX. Hydropower: A Viable Solution for China’s Energy Future? 2007. World Watch Institute. Available from: http://www.worldwatch.org/node/4908
19.Dams in China. Wikipedia.org. Available from: http://en.wikipedia.org/wiki/Category:Dams_in_China
20.Renewable Energy in China: Grid Connected Wind Power. National Renewable Energy Lab. Available from: http://www.nrel.gov/docs/fy04osti/35789.pdf
21.Gang W. Wind matters: China’s role in the future of wind (PDF). Goldwind. 28 October 2015. Retrieved 8 February 2016.
22.China’s new wind power capacity hits record high - Xinhua — English.news.cn. Available from: news.xinhuanet.com. Retrieved 2016-02-08
23.Xinhua, China’s wind power capacity continues to grow. Available from: http://www.globaltimes.cn/content/1030911.shtml/ [dead link accessed 24/06/2017]
24.Daniel C. Climate Wire, China blows past the U.S. in wind power. Scientific American. Retrieved from: 2016-02-08
25.Gow D. Wind power becomes Europe’s fastest growing energy source. Tuesday February 3, 2009. Gardian.co.uk. Available from: http://www.guardian.co.uk/environment/2009/feb/03/wind-power-eu
26.Wind Electricity Installed Capacity. International Energy Statistics. Energy Information Administration (EIA)
27.Nicholas S, He J. How China became a climate leader. 2014. Available from: Eco Business http://www.eco-business.com/opinion/how-china-became-climate-leader/. Accessed 20/09/2017
28.REN21. Renewables 2016 global status report. Renewable energy policy network for the 21st Century. 2016
29.Blauvelt, E. Biomass in China. World Energy Discussion. Jan 14, 2008. Available from: http://worldenergydiscussion.blogspot.com/2008/01/biomass-in-china.html
31.Zhang D et al. Present situation and future prospect of renewable energy in China. Renewable and Sustainable Energy Reviews. 2017;76:865-871
32.China is adding solar power at a record pace. Available from: Bloomberg.com. 19 July 2017. Retrieved 1 August 2017
33.World Watch Institute. Solar energy booming in China. Available from: worldwatch@worldwatch.org 1400 16th St. NW, Ste. 430, Washington, DC 20036, access November 22, 2017
34.Zhang D, Li W, Lin Y. Wave energy in China: Current status and perspectives. Renewable Energy. 2009;34:2089-2092
35.Liu T, Xu G, Cai P, Tian L, Huang Q. Development forecast of renewable energy power generation in China and its influence on the GHG control strategy of the country. Renewable Energy. 2011;36:1284-1292
36.NRDC White Paper – Improving China’s existing renewable energy legal framework; lessons from the International and Domestic Experience, Natural Resources Defense Council. October 2010
37.Jin Yang X, Hu H, et al. China’s renewable energy goals by 2050. Environmental Development. 2016;20:83-90 ISSN 2211-4645
38.IEA. World Energy Outlook 2017. Available from:https://www.iea.org/weo/china/. Accessed 20 December 2017
39.Wang S, Yuan P, Li D, Jiao Y. An overview of ocean renewable energy in China. Renewable and Sustainable Energy Reviews. 2011;15:91-111
40.Here’s how much money China is throwing at renewable energy. Available from: http://fortune.com. Retrieve 10 November 2017
41.IRENA. Renewable Energy Prospects. China: International Renewable Energy Agency; 2017
42.Energy Research Institute. China 2050 high renewable energy penetration scenario and roadmap study National Development and Reform Commission. 2015
43.Kumar A, Kumar K, Kaushik N, Sharma S, Mishra S. Renewable energy in India: Current status and future potentials. Renewable and Sustainable Energy Reviews. 2010;14:2434-2442
44.Nicholas S, He J. How China became a climate leader. 2014. Available from: http://www.eco-business.com/opinion/how-china-became-climate-leader/. Eco Business
Written By
Daniel Adu, Ransford O. Darko, Boamah Kofi Baah and Agnes Abbey
Submitted: May 2nd, 2022Reviewed: July 12th, 2022Published: January 31st, 2023