
Mean value of color parameters of plantain cultivars by ripening and processing methods.
Abstract
Recently breeders have developed high-yielding and disease-resistant hybrid plantain varieties that need evaluation for end-use. This study evaluated the effect of ripening and processing methods on the color, nutritional, and mineral properties of hybrid plantain cultivars. Plantain pulps were subjected to frying (170°C for 2 min), boiling (100°C for 15 min), and drying (65°C for 48 h) at unripe and ripe stages before analysis. Ripening and processing methods had a highly significant (p < 0.05) effect on all color and nutritional composition but significant on some minerals such as potassium. There was an interactive effect between ripening and processing methods on all color parameters and nutritional composition. In conclusion, fried samples recorded the highest mineral composition and vitamin C values, while boiled samples had the highest total carotenoid and color properties. Unripe plantain showed the most increased potassium, magnesium, calcium, and sodium contents. Processing plantain fruits at unripe stages were the best option to optimize nutrient availability.
Keywords
- plantain
- ripeness
- processing
- color
- nutritional qualities
1. Introduction
Plantain (
Processing plantains before storage rather than directly storing freshly harvested fruit has been advocated as one of the alternatives to reduce postharvest losses. Processing improves the digestibility of foods, promotes palatability, improves their keeping quality, and makes the food safer. However, processing may affect food’s nutritional and mineral composition. Many nutritive minerals are essential to living organisms because they activate enzymes, hormones, and other organic molecules that participate in the growth, function, and maintenance of life processes. The consumption of plantain have been reported to provide an invaluable source of carbohydrate and caters to the calorific need of many developing countries ([6]). According to Anajekwu
Plantains contains high amount of bioactive compounds like phenolic compounds, flavonoids, carotenoids and bio-genic amines. Phenolic compounds such as gallic acid, catechin, epicatechin, tannins and anthocyanins. The bioactive compounds have a clear therapeutic benefits to human health by contributing towards antioxidant activities [8]. These bioactive compounds are present in the raw and ripened plantains. Plantain pulps also contain a low levels of some phytosterols. Carotenoids are pro-vitamins which provide health benefits due to their physiological functions and serve as an antioxidants that scavenge singlet oxygen released in human body. Phytosterols are naturally plant sterols which serve as a functional ingredient that have health benefits such as lowering blood cholesterol level and its absorption in the intestine. Generally, the antioxidant activities of these bioactive compounds play a major role in reducing the risk of diseases such as, diabetes, heart problems and eye diseases which is on the rise throughout the world [9].
Black Sigatoka disease
However, until now, published studies are scarce on the effect of ripening and processing methods on the nutritional, mineral, color, dry matter, ascorbic acid (Vitamin C), and total carotenoid content of hybrid plantain cultivars. Therefore, the main objective of this study is to determine the impact of ripening and processing methods on the color, nutritional and mineral composition of selected hybrid plantain cultivars.
Advertisement
Moisture content = M 1 − M 2 x 100 M 1 − M 0 E1Ash content = W 3 − W 1 x 100 W 2 % Nitrogen = sample titre – blank titre x M x 14.007 x 100 Sample weight % Fat = W 3 − W 2 X 100 W 1 % Crude fiber = Difference in weight x 100 . % Carbohydrate = 100 – Moisture + Ash + Fat + Protein + Fiber contents . % Sugar = A − I x D . F x V x 100 B x W x 106 % Starch = A − I x D . F x V x 0.9 x 100 B x W x 106 Mineral content mg / kg = Concentration ppm x DF Sample weight g ΔE = ΔL 2 + Δa 2 + Δb 2 1 / 2 TC μg / g = A total x volume ml x DF x 104 A 1 cm 1 % x sample weight g
2. Materials and methods
2.1 Materials
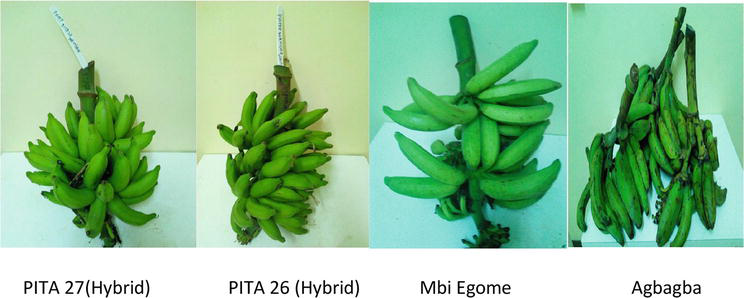
The selected hybrid plantain cultivars were harvested from the International Institute of Tropical Agriculture (IITA) plantain and banana research farm, Ibadan, Oyo state, South/West Nigeria (7°22′N, 3°58′E, altitude 225 m). Four plantain varieties were evaluated:
2.2 Frying of plantain fingers
Unripe and ripe plantain bunches were separated into individual fingers, washed, peeled, and then sliced longitudinally into small round slices (2 mm thickness) with the aid of a sterile stainless-steel kitchen knife and fried in vegetable oil (specific gravity of 0.92 g/cm3) for 2 minutes at 170°C. After frying, it was cooled and packaged in a polyethylene bag for further analysis at 30 ± 2°C [11].
2.3 Boiling of plantain fingers
Fingers of plantain were selected randomly from each set (unripe and ripe) and cut into a cooking pot containing 2 L of water each and then cooked for 15 min at 100°C. The peel of the plantain was not removed to prevent the leaching of nutrients into the boiling water during cooking. After the boiling, each set of plantain was drained out of hot water and cooled for 10 min before the peels were removed according to the method described by [12] with slight modification.
2.4 Production of plantain flour by drying
The method described by Anajekwu
2.5 Chemical composition of plantain
The plantain samples’ moisture, ash, fat, protein, fiber, sugar, starch, and dry matter contents were determined as described by AOAC methods.
2.5.1 Moisture and dry matter content
Moisture content was determined using the method of AOAC [13]. Plantain sample (5 g) was weighed into a pre-weighed clean dried dish, after which the dish was placed in a well-ventilated oven (UF55 Memmert Oven model) maintained at 103 ± 2°C for 16 h. Transferred to the desiccator at room temperature to cool. After cooling for about 30 min, it was weighed as quickly as possible. The loss in weight was recorded as moisture and moisture content was calculated using the equation below:
where Mo = Weight in g of dish.
M1 = Weight in g of dish and sample before drying.
M2 = Weight in g of dish and sample after drying.
Note that M1-M0 = weight of sample prepared for drying.
% Dry Matter Content = 100 - % Moisture Content.
2.5.2 Ash content
This was determined by the method of AOAC [13]. It involves burning off all organic constituents at 600°C for 6 h in a furnace (VULCANTM furnace model 3–1750). Crucibles were washed, dried and allowed to cool in the desiccators. Each sample (3 g) was weighed into weighed crucibles. The weight of the residue after incineration was recorded as the ash content.
W3 = Weight of crucible+ ash.
W2 = Weight of sample only.
W1 = Weight of empty crucible.
2.5.3 Protein content
Crude protein was determined using Kjeldahl method ([14], Method 46-12.01). Exactly 0.2 g of sample was weighed in a paper and transferred into a digestion tube and one tablet of Kjeldahl catalyst (copper) and 4 ml of conc. H2SO4 were added. This was transferred into a fume cupboard and 4 ml of H2O2 was added, fuming was allowed to stop. The mixture was placed on Tecator digestion block pre-set at 420°C and digested for 1 h; at the end of which all organically-bound nitrogen was converted to Ammonium Hydrogen Sulphate. With the addition of a strong alkali (NaOH, 40%) and the application of heat, ammonia NH3 was distilled out, and collected in 1% boric acid receiver solution containing Bromocresol green/methyl red mix indicator. Blanks (Paper plus Kjeldahl catalyst) were prepared and treated similarly. Rack of digestion tubes was removed from the block and allowed to cool to room temperature.
The tube containing the blank sample was placed in the distillation unit of the system, and the weight of the sample to be analyzed was entered using the key board on the system and the system was programmed to automatically perform the distillation and titration of the sample. Likewise, in turns, the tubes containing the samples digest were placed in the distilling unit of the system. The system was also programmed to automatically perform the distillation and titration. Results were displayed automatically at the end of each analysis according to the following equation:
Calculation:
% Protein (crude) = % g Nitrogen x Conversion factor.
M = Molarity of the acid.
2.5.4 Fat content
An automated method (Soxtec™ 8000 System, [14]) was used to determine crude fat. About 3 g of samples was weighed; transferred into a clean thimble plugged with cotton wool and inserted into the Soxtec™ 8000 apparatus. Clean pre-weighed extraction cup containing 50 ml n-hexane was placed on the heating mantle of the apparatus previously heated up to 120°C and then the thimble containing the sample was lowered into it. This set up was left in this boiling position for 15 minutes. After the extraction the thimble (i.e. sample) was lifted up and left in the rinsing position for 45 minutes. Thereafter, air knob was turned on and the hexane was allowed to evaporate for some 10 m minute. Extraction cup was further dried in hot-air oven for 20–30 minutes at 105°C to rid it of residual hexane. This was cooled in the desiccator and weighed. Fat content was calculated as follows:
W3 = Weight of the cup with extracted oil.
W2 = Weight of the empty cup.
W1 = Weight of sample.
2.5.5 Fiber content
An automated method (FibertecTM, [13]) was used to determine crude fiber content. About 0.5 g of celite and 1 g of already defatted samples was weighed into the pre-weighed glass crucibles. The equipment was turned on and R1 was pressed to heat the reagents. The crucibles were inserted using the holder and lock into position in front of the radiator in the Fibretec hot extraction unit ensuring that the safety latch engages. Placed the reflector in front of the crucibles and put all the valves in closed position. The cold water tap was opened for 1–2 minutes for reflux system. The pre-heated reagents were added into each column and 2–4 drops of n-octanol was added to prevent foaming, turned on the heater control fully clockwise. When the reagents started boiling, adjustment was made to moderate boiling using the heater control. The boiling time was measured from the time when the solution has reached the boiling point. At the end of extraction, the heater was turned off and placed the valves in Vacuum position and the cold water tap was opened to full flow rate for the water suction pump and started filtration. The crucible containing the residue was released with the safety hook. The crucible containing residue was dried overnight in 70°C vacuum oven. Cooled in desiccator and took the weight. The crucible containing residue was incinerated for at least 3 h at 525 ± 15°C, removed crucible from the furnace after it is cooled down 250°C. Cooled in desiccator and weighed.
2.5.6 Carbohydrate content
2.5.7 Starch and sugar content
This was carried out according to the method described by AOAC [14]. Finely ground sample (0.02 g) was weighed into centrifuge tubes and 1 ml of 95% ethanol was added, followed by 2 ml of distilled water and 10 ml hot ethanol. The mixture was vortexed and centrifuged at 2000 rpm for 10 min. The supernatant was collected and used for free sugar analysis, while the residue was used for starch analysis.
To the residue 7.5 ml of concentrated perchloric acid was added and allowed to hydrolyze for 1 h. It was then diluted to 25 ml with distilled water and filtered through Whatman No. 2 filter papers. From the filtrate 0.05 ml was taken, made up to 1 ml with distilled water, vortexed and the color was developed by adding 0.5 ml phenol followed by 2.5 ml of conc. H2SO4. This was vortexed, allowed to cool to room temperature and the absorbance was read on a spectrophotometer (Genesys 10S UV–VIS, USA, Model) at 490 nm. To the supernatant made up to 20 ml with distilled water, an aliquot of 0.2 ml was taken, 0.5 ml (5%) phenol and 2.5 ml conc. H2SO4 was added. This was allowed to cool and the absorbance read at 490 nm.
The glucose standard solution was prepared by weighing 0.01 g of D-glucose into a 100 ml volumetric flask. This was dissolved and made up to 100 ml mark with distilled water. 0.1, 0.2, 0.3, 0.4 and 0.5 ml of the stock (100 μg/ml glucose) solution was dispensed into test tubes and each was made up to 1.0 ml with distilled water. This corresponds to 10, 20, 30, 40, and 50 μg glucose per ml. this was then followed by the addition of 0.5 ml of 5% phenol and 2.5 ml of H2SO4, vortexed, cooled and the absorbance read at 490 nm. Then a graph (standard glucose curve) of Absorbance against Concentration was plotted to determine the slope and intercept.
The sugar and starch content was determined by the calculation below:
A = Absorbance of sample
I = Intercept of sample
D.F = Dilution factor (depends on aliquot taken for assay)
V = Volume
B = Slope of the standard curve
W = Weight of the sample
2.6 Mineral composition of plantain
The mineral analysis was determined using an inductively coupled plasma optical emission spectrometer (ICP-OES) by the method described by AOAC [13] and Anajekwu
D.F = Dilution factor
2.7 Color parameters
The method described by Anajekwu et al. [2] was used for the color parameters (L*, a*, and b*) determination using a Chromater (Color-Tec-PCM TM, Omega Engineering Inc., Stanford, CT). The colorimeter was standardized, and samples were placed in the sample holder. The color measurement (L*, a*, b*) was done in triplicates. The color intensity (ΔE) was calculated using the formular:
2.8 Vitamin C content
Vitamin C content was determined according to the method described by Amoros
2.9 Total carotenoid composition
The method described by Anajekwu
Total carotenoid (TC spec) was calculated as follows:
where, Atotal = absorbance at 450 nm, DF = dilution factor, Volume (ml) = total volume of extract (25mls), A1%1cm = 2592 (absorption coefficient of beta-Carotene in petroleum ether (PE).
2.10 Statistical analysis
The data obtained in the laboratory were subjected to analysis of variance (ANOVA) using the Statistical Analytical System (SAS) package (SAS 9.3 version) [16], and the means were separated using Least Significant Difference (LSD). The significance test was done at the 5% probability level (p < 0.05).
Advertisement
3. Results and discussion
3.1 Color parameters of plantain cultivars as affected by ripening and processing methods
Table 1 shows the color parameters of PITA 26, PITA 27, Mbi Egome and Agbagba fruit pulp as affected by ripening and processing methods. The analysis of variance (ANOVA) result showed that varieties, processing methods, ripening stages and had a highly significant effect (p < 0.001) on the color properties (L*, a*, b* and ∆E) of the plantain varieties studied. Color parameters significantly increased with ripeness (P < 0.05), particularly for PITA 26 and PITA 27. The lightness L* ranged from 26.55–62.88 for PITA 26, 29.99–63.24 for PITA 27, 28.18–68.15 for Mbi Egome and 32.05–65.60 for Agbagba. Dried fruits had the highest lightness for all ripening stages, followed by boiled fruits. The drying process significantly impacted increased lightness, which could be attributed to the loss of moisture and non-enzymatic Maillard browning, which occurred under the conditions prevailing during the drying process, favoring color change [17]. Similar result of lightness (L > 50) was observed for plantain flour reported by Fadimu
| Sample/Ripening stage | Processing Methods | L* | a* | b* | ∆E |
|---|---|---|---|---|---|
| PITA 26 Unripe (Stage 1) | Frying | 30.18b | 4.28f | 11.07c | 1.79a |
| Drying | 62.88g | −4.17b | 12.12d | 34.74g | |
| Boiling | 49.78d | −4.91b | 18.59f | 23.34e | |
| Raw | 49.43d | 0.17d | 16.68e | 21.20d | |
| PITA 26 Ripe (Stage 5) | Frying | 26.55a | 2.67e | 8.34a | 4.55b |
| Drying | 60.12f | −7.11c | 10.22b | 33.17g | |
| Boiling | 55.60e | −7.51c | 23.73g | 31.05f | |
| Raw | 44.99c | −0.15a | 16.42e | 16.98c | |
| PITA 27 Unripe(Stage 1) | Frying | 38.84b | 0.17e | 14.58c | 10.68b |
| Drying | 63.24h | −5.22c | 13.36b | 35.36g | |
| Boiling | 53.80e | −5.63c | 21.37e | 28.01e | |
| Raw | 48.50d | −0.01a | 15.72d | 20.15d | |
| PITA 27 Ripe(Stage 5) | Frying | 29.99a | −0.49b | 3.35a | 9.65a |
| Drying | 61.32g | −7.34d | 3.33a | 39.42h | |
| Boiling | 58.83f | −7.41d | 22.86f | 33.53f | |
| Raw | 41.57c | −0.57b | 14.76c | 13.47c | |
| Mbi Egome Unripe (Stage 1) | Frying | 52.38c | −4.48b | 26.95g | 28.82e |
| Drying | 67.00f | −6.78d | 17.26c | 39.71g | |
| Boiling | 53.17d | −2.98a | 22.74f | 27.20d | |
| Raw | 50.35b | 2.33g | 20.05d | 22.82b | |
| Mbi Egome Ripe (Stage 5) | Frying | 28.18a | 2.04f | 10.46b | 2.31a |
| Drying | 68.15g | −5.16c | 7.45a | 38.14f | |
| Boiling | 61.93e | −4.26b | 31.60h | 39.05g | |
| Raw | 50.80b | 1.75e | 21.12e | 23.67c | |
| Agbagba Unripe (Stage 1) | Frying | 52.94d | −4.34b | 26.59g | 29.07d |
| Drying | 65.60h | −5.55c | 13.69c | 37.76h | |
| Boiling | 59.74f | −3.73a | 25.98f | 34.49f | |
| Raw | 48.02b | 1.82f | 17.97d | 19.99b | |
| Agbagba Ripe (Stage 5) | Frying | 32.05a | 1.13d | 7.25b | 6.20a |
| Drying | 63.11g | −3.20a | 5.20a | 36.48g | |
| Boiling | 54.58e | −3.46a | 27.25h | 30.54e | |
| Raw | 50.87c | 1.45e | 19.08e | 23.06c |
Table 1.
Means followed by different superscripts within a column indicate a significant difference (p < 0.05). L* = lightness, a* = Redness, b* = Yellowness, ∆E = Color intensity.
However, the lightness of the fried chips significantly decreased as ripening progressed [18], this is similar to the results in this study. Frying reduced the lightness of the fruits. Redness a* varied across the ripening stages and processing methods. Redness significantly (P < 0.05) decreased with ripeness for PITA 26 and PITA 27 but increased with ripeness for Mbi egome and Agbagba which is similar to the report by Mba
3.2 Chemical composition of plantain cultivars as affected by ripening and processing methods
Table 2 shows the chemical compositions of selected plantain cultivars as affected by the ripening and processing method. The analysis of variance (ANOVA) showed that variety had a significant (p < 0.001) effect on all the chemical properties except protein. However, the processing method and ripening stage had a highly significant (p < 0.001) effect on the chemical components of the plantain cultivars. However, the second level interaction of variety x processing method, processing method x ripening stage, and variety x processing method had a significant (p < 0.001) on all the chemical parameters, except a slight significance (p < 0.05) for protein.
| Sample/Ripening stage | Processing Methods | Ash | Fat | Protein | CHO | Sugar | Starch | MC | Vit. C (mg/100 g) | TC μg/g |
|---|---|---|---|---|---|---|---|---|---|---|
| PITA 26 Unripe (Stage 1) | Frying | 2.29d | 17.91f | 1.43d | 68.91e | 8.82e | 91.54h | 8.60c | 8.29e | 1.19a |
| Drying | 3.33e | 1.20d | 2.93f | 85.66g | 6.29b | 89.37g | 6.15a | 10.25f | 2.92b | |
| Boiling | 1.53b | 0.72b | 0.49a | 28.17c | 2.00a | 49.12d | 68.56f | 7.31d | 4.18c | |
| Raw | 1.25a | 1.69f | 0.90c | 27.84c | 2.10a | 46.90c | 67.13e | 14.94g | 1.71a | |
| PITA 26 Ripe (Stage 5) | Frying | 1.65c | 28.97g | 1.90e | 41.27d | 18.99g | 35.14a | 25.53d | 5.49b | 1.99a |
| Drying | 1.51b | 1.33d | 0.65b | 82.21f | 11.66f | 83.73f | 7.24b | 6.21c | 2.09b | |
| Boiling | 1.26a | 0.79c | 0.52a | 23.42a | 6.97c | 56.98e | 72.84h | 4.23a | 5.04d | |
| Raw | 1.20a | 0.60a | 0.70b | 26.82b | 7.58d | 37.28b | 69.38g | 7.71d | 4.92c | |
| PITA 27 Unripe (Stage 1) | Frying | 2.48d | 11.31c | 1.55e | 74.43f | 5.39b | 80.07f | 9.48b | 9.13d | 5.89d |
| Drying | 3.69e | 0.78a | 2.99f | 85.27h | 8.59c | 81.22g | 6.47a | 10.97e | 5.18d | |
| Boiling | 1.64b | 0.47a | 0.69b | 28.50c | 1.78a | 57.24d | 67.42g | 7.43b | 6.85e | |
| Raw | 1.49b | 0.99a | 0.90c | 29.68d | 1.61a | 66.46e | 66.23d | 16.96f | 4.67c | |
| PITA 27 Ripe (Stage 5) | Frying | 1.90c | 25.44d | 1.60e | 39.97e | 33.13g | 35.21c | 28.64c | 7.14b | 1.98a |
| Drying | 1.66b | 2.02b | 1.25d | 80.15g | 13.79e | 84.45h | 6.24a | 8.18c | 3.21b | |
| Boiling | 1.41b | 0.81a | 0.58a | 19.92a | 12.88d | 30.43b | 75.14f | 6.06a | 5.28d | |
| Raw | 1.29a | 0.72a | 0.54a | 27.46b | 14.65f | 29.96a | 68.61e | 9.40d | 7.12f | |
| Mbi Egome Unripe (Stage 1) | Frying | 1.60b | 11.94e | 2.02d | 78.56g | 6.30b | 85.47g | 5.20a | 7.89b | 5.43a |
| Drying | 2.01c | 0.80c | 2.86e | 86.95h | 9.33c | 84.34f | 6.48b | 8.27c | 18.08f | |
| Boiling | 1.05a | 0.62b | 0.53a | 30.58b | 1.90a | 43.62c | 64.91f | 6.02a | 24.19h | |
| Raw | 1.07a | 0.60b | 0.81b | 36.58d | 1.59a | 54.02e | 60.31d | 9.42d | 19.77g | |
| Mbi Egome Ripe (Stage 5) | Frying | 1.44b | 23.68f | 1.90c | 64.56e | 23.21f | 51.02d | 7.17c | 7.35b | 6.29b |
| Drying | 1.66b | 2.50d | 1.77c | 75.60f | 16.82e | 85.33g | 6.42b | 8.30c | 10.42c | |
| Boiling | 2.09c | 0.12a | 0.65a | 23.21a | 6.56b | 33.23a | 73.35g | 7.31b | 13.58d | |
| Raw | 1.06a | 0.50b | 0.86b | 34.63c | 10.28d | 39.54b | 62.16e | 10.37e | 14.72e | |
| Agbagba Unripe (Stage 1) | Frying | 2.73d | 11.27e | 1.76d | 73.94f | 8.95b | 90.13g | 9.29b | 9.21b | 5.98b |
| Drying | 3.34e | 0.49b | 2.47e | 85.46h | 6.75a | 93.96h | 7.27a | 10.54c | 4.87a | |
| Boiling | 1.06a | 1.82c | 0.76a | 33.07c | 6.34a | 67.33d | 62.78f | 9.04b | 17.42e | |
| Raw | 1.50b | 0.15a | 1.00b | 37.52d | 6.30a | 78.80e | 56.69d | 14.19d | 11.46d | |
| Agbagba Ripe (Stage 5) | Frying | 2.69c | 22.18f | 1.48c | 39.39e | 20.13f | 61.48c | 32.58c | 8.70a | 7.06c |
| Drying | 2.01c | 2.11d | 1.37c | 81.06g | 13.10e | 82.11f | 7.12a | 8.96a | 11.23d | |
| Boiling | 1.21b | 0.24a | 0.82a | 26.64a | 9.26c | 32.88a | 69.23g | 8.69a | 19.51g | |
| Raw | 1.42b | 0.13a | 0.36a | 34.81b | 10.50d | 35.34b | 62.58e | 9.50b | 18.81f |
Table 2.
Mean value of some chemical composition of plantain cultivars (g/100 g) by ripening and processing methods.
Means followed by different superscripts within a column indicate a significant difference (p < 0.05). TC = Total Carotenoid, MC = Moisture content, Vit = Vitamin, CHO=Carbohydrate.
It implies that variety, processing method, and ripening stage affect the chemical contents of plantain cultivars. Among the explanatory variables, the variable variety is more influential for all the chemical components except protein, where the processing method and ripening stage are the most influential variables. Thus, the processing methods and ripening stages strongly affected the concentration of ash, fat, protein, carbohydrate, sugar, starch, moisture, vitamin C and total carotenoid content of plantain cultivars. The result agrees with what Ayodele
Ash content reflects mineral status and the inorganic residue after the water and organic matter have been removed by burning a food sample [19]. Ash content ranged from 1.20–3.33 g/100 g for PITA 26, 1.29–3.69 g/100 g for PITA 27, 1.05–2.09 g/100 g for Mbi Egome and 1.06–3.34 g/100 g for Agbagba respectively. Dried fruits had the highest ash content for PITA 26, PITA 27 and Agbagba at the unripe stages. However, boiled fruits had the least ash content for Mbi Egome and Agbagba. The ash contents of the raw plantain fruits at both unripe and ripe stages is similar to the result reported by Okareh
Fat contents ranged from 0.60–28.97 g/100 g for PITA 26, 0.47–25.44 g/100 g for PITA 27, 0.12–23.68 g/100 g for Mbi Egome, 0.13–22.18 g/100 g for Agbagba respectively and significantly (P < 0.05) increased with ripeness. Fried fruits had the highest content of fat at the ripe and unripe stages for all cultivars, which can be attributed to the addition of fat from the frying oil. A similar higher result was reported by Omotosho
Protein content was not significantly influenced by ripeness and the processing methods employed. Still, it was correspondingly low in all the boiled fruits across the ripening stages for all the cultivars studied. The low protein content is characteristic of plantain [1, 19]. Protein content ranged from 0.49–2.93 g/100 g for PITA 26, 0.54–2.99 g/100 g for PITA 27, 0.53–2.86 g/100 g for Mbi Egome and 0.36–2.47 g/100 g for Agbagba respectively. Protein is essential in the human diet to grow and repair worn-out tissues. Dried fruits at the unripe stage had the highest protein for all cultivars studied, whereas fried fruits at the ripe stage recorded the least protein for all cultivars studied. Relatively high protein content in dried fruits may be due to protein modification or loss of moisture during the drying process, which eventually increases other nutrient compositions [19].
The carbohydrate levels were significantly (P < 0.05) higher at the unripe stages. Carbohydrate was relatively high in dried and fried fruits at all the fruit ripening stages but correspondingly low in boiled fruits. The carbohydrate content ranged from 23.42–85.66 g/100 g for PITA 26, 19.92–85.27 g/100 g for PITA 27, 23.21–86.95 g/100 g for Mbi Egome and 26.64–85.46 g/100 g for Agbagba respectively. Higher carbohydrates in dried and fried fruits may be due to moisture loss during drying and frying, which increases the concentration of soluble matter [19]. At the same time, the boiling process adds more moisture to the fruits leading to a drop in the concentration of soluble matters. Processing methods had been reported to improve carbohydrate availability in a more digestible form ([22]) which explained the significant increase in carbohydrates of dried and fried fruits. Similar result of carbohydrate for dried plantain flour was obtained as that reported by Okole
The moisture content of processed food gives an indication of its anticipated shelf life. Food with low moisture contents remains in good condition for a longer time than the one with high moisture content [19]. The moisture content significantly (P < 0.05) increased with ripening and was correspondingly low in dried and fried fruits across the ripening stages because of heat application. Moisture content was significantly (P < 0.05) high in boiled and raw fruits at all ripening) stages. The moisture ranged from 6.15–72.84 g/100 g for PITA 26, 6.24–75.14 g/100 g for PITA 27, 6.42–73.35 g/100 g for Mbi Egome and 7.21–69.28 g/100 g for Agbagba respectively. Okole
The sugar content ranged from 2.00–18.99 g/100 g for PITA 26, 1.61–33.13 g/100 g for PITA 27, 1.59–23.21 g/100 g for Mbi Egome, 6.30–20.13 g/100 g for Agbagba and significantly (P < 0.05) increased with ripeness. Fried fruits at the ripe stage had the highest sugar content. Sugar was relatively high in fried and dried fruits at ripening stages but correspondingly low in boiled fruits. Raw fruits at the ripe stage showed higher sugar content than those at the unripe stage for all cultivars studied. As ripening continues, the starch content is broken down to sugar. As the ripening process increased, the starch content decreased. Fried and dried fruits had the highest starch at the unripe stage. The starch content ranged from 35.14–91.54 g/100 g for PITA 26, 29.96–81.22 g/100 g for PITA 27, 33.23–85.47 g/100gfor Mbi Egome and 32.88–93.96 g/100gfor Agbagba respectively. Raw fruits at the unripe stage of ripeness recorded higher starch content than the raw ones at ripe stages. As ripening continues, the starch content breaks down into sugars.
Vitamin C is a very good antioxidant, and highly cherished in mopping up reactive oxygen species in the body. Since the meals from this food sample are usually eaten with vegetables, it means this difference can always be made up from other ingredients used in cooking plantain meals [23]. Vitamin C content ranged from 4.23–14.94 mg/100 g for PITA 26, 6.06–16.96 mg/100 g for PITA 27, 6.02–10.37 mg/100 g for Mbi Egome and 8.69–14.19 mg/100 g for Agbagba respectively. Raw fruits at the unripe stage recorded the highest vitamin C for all cultivars except Mbi Egome. This may be due to varietal differences between the cultivars. Vitamin C was relatively high in dried and fried fruits at all the fruit ripening stages but correspondingly low in boiled fruits. This suggests that drying and frying significantly affected fruits by increasing the ascorbic acid because of moisture removal, which raised other nutritional components. Yarkwan and Uvir [23] reported vitamin C content of 5.00 mg/100 g for fresh unripe plantain which is lower than the values reported for raw unripe plantain in this study and this may be due to differences in variety of plantains.
Total carotenoid content significantly (P < 0.05) improved with ripening. Carotenoid is one of the most important classes of plant pigment and plays a critical role in defining the quality parameters of fruit and vegetables. The total carotenoid content ranged from 1.19–5.04 μg/g for PITA 26, 1.98–5.28 μg/g for PITA 27, 6.29–24.19 μg/g for Mbi Egome and 7.06–19.51 μg/g for Agbagba respectively. Boiling seemingly increased the total carotenoid content across the fruit ripening stages. In most cases, boiled and dried fruits had a relatively higher total carotenoid content. The raw fruits at the ripe stage recorded higher total carotenoid content than the raw fruits at the unripe stage. The increase in carotenoid content observed in this study could be explained by the fact that maturation or ripening of fruits and vegetables is usually accompanied by enhanced carotenogenesis and provided the fruit or vegetable remains intact; this continues to occur even after harvest [24].
3.3 Mineral composition of plantain cultivars as affected by ripening and processing methods
Table 3 shows the effects of varying fruit ripening stages and processing methods on the mineral composition of PITA 26, PITA 27, Mbi Egome and Agbagba fruit pulp. Calcium content ranged from 7.82–10.85 mg/Kg for PITA 26, 8.00–11.98 mg/Kg for PITA 27, 7.43–10.30 mg/Kg for Mbi Egome and 7.48–10.41 mg/Kg respectively. Dried fruits had the highest concentration of calcium in all ripening stages. Fried fruits, in most cases, had a relatively high calcium content. Processing by boiling seemingly reduced the fruit’s calcium content. Excessive level of calcium can cause constipation. This high calcium concentration might also impede the body’s ability to absorb other minerals like iron and zinc [25]. Fruit Magnesium content significantly (P < 0.05) decreased with ripeness, particularly for PITA 27, Mbi Egome and Agbagba cultivars. Boiling seemingly reduced the fruit’s Magnesium content. Fried and dried fruits had the highest magnesium concentration in most ripening stages for all cultivars studied. Magnesium content ranged from 8.56–25.32 mg/Kg for PITA 26, 9.78–29.11 mg/Kg for PITA 27, 9.48–28.99 mg/Kg for Mbi Egome and 11.25–27.25 mg/Kg for Agbagba respectively.
| Sample/Ripening stage | Processing Methods | Ca | Mg | K | Na | Mn | Fe | Cu | Zn | Al |
|---|---|---|---|---|---|---|---|---|---|---|
| PITA 26 Unripe (Stage 1) | Frying | 10.74d | 25.32g | 365.20g | 6.39d | 0.16b | 0.59b | 0.19a | 0.05a | 0.86d |
| Drying | 10.77d | 24.73f | 366.45g | 6.30d | 0.15b | 0.66a | 0.25b | 0.12b | 0.59b | |
| Boiling | 8.08b | 8.56a | 88.23a | 5.29b | 0.03a | 0.37a | 0.12a | 0.01a | 0.47a | |
| Raw | 7.82a | 9.73b | 114.34b | 5.01a | 0.05a | 1.53d | 0.29b | 0.01a | 0.54b | |
| PITA 26 Ripe(Stage 5) | Frying | 10.25d | 21.39e | 311.60f | 6.06c | 0.13b | 0.57b | 0.23b | 0.05a | 0.66c |
| Drying | 10.85d | 21.13e | 309.23e | 6.00c | 0.11b | 0.58b | 0.31c | 0.10b | 0.61b | |
| Boiling | 8.74c | 12.45c | 153.65c | 5.53b | 0.06a | 0.56b | 0.41d | 0.02a | 0.58b | |
| Raw | 8.48c | 13.51d | 184.45d | 5.45b | 0.06a | 0.72c | 0.26b | 0.03a | 0.58b | |
| PITA 27 Unripe(Stage 1) | Frying | 10.39e | 21.52e | 358.85g | 6.30b | 0.09b | 0.64b | 0.16a | 0.45d | 0.62a |
| Drying | 11.98f | 29.11g | 528.50h | 6.30b | 0.03a | 0.67b | 0.40c | 0.29c | 0.68b | |
| Boiling | 9.45d | 9.78a | 126.66b | 5.80a | 0.02a | 0.47a | 0.18a | 0.24c | 0.62b | |
| Raw | 9.99d | 12.26d | 176.90d | 5.60a | 0.03a | 0.49a | 0.26b | 0.01a | 0.79b | |
| PITA 27 (Ripe Stage 5) | Frying | 9.13c | 21.83e | 346.95f | 6.22b | 0.07b | 0.43a | 0.23b | 0.10b | 0.50a |
| Drying | 10.12e | 22.14f | 351.10e | 6.24b | 0.04a | 0.42a | 0.33c | 0.06a | 0.41a | |
| Boiling | 8.86b | 10.62b | 123.9a | 5.82a | 0.03a | 0.92c | 0.39c | 0.01a | 0.68b | |
| Raw | 8.00a | 11.62c | 150.70c | 5.48a | 0.04a | 0.55b | 0.29b | 0.02a | 0.56a | |
| Mbi Egome Unripe (Stage 1) | Frying | 10.30d | 23.67c | 291.20f | 6.20c | 0.08b | 0.77b | 0.31b | 0.08b | 0.77d |
| Drying | 10.08d | 28.99f | 380.65g | 6.48c | 0.09b | 0.85c | 0.39b | 0.18b | 0.77d | |
| Boiling | 9.51c | 9.48a | 79.30a | 5.11b | 0.02a | 0.55a | 0.26a | 0.01a | 0.61c | |
| Raw | 8.85b | 10.78b | 100.59d | 5.76b | 0.02a | 0.41a | 0.22a | 0.01a | 0.52b | |
| Mbi Egome Ripe (Stage 5) | Frying | 8.63b | 24.05d | 287.65e | 6.01c | 0.08b | 0.75b | 0.27a | 0.11b | 0.53b |
| Drying | 8.61b | 25.12e | 290.22f | 6.10c | 0.10b | 0.80c | 0.31b | 0.17c | 0.56b | |
| Boiling | 7.43a | 9.91a | 90.01b | 5.20b | 0.02a | 0.49a | 0.22a | 0.03a | 0.48a | |
| Raw | 7.93a | 10.06b | 94.37c | 4.72a | 0.02a | 0.48a | 0.50c | 0.07a | 0.53b | |
| Agbagba Unripe (Stage 1) | Frying | 7.56a | 23.83f | 342.85h | 6.66b | 0.10b | 0.58a | 0.29b | 0.12b | 0.52a |
| Drying | 9.46b | 27.25g | 328.30g | 7.24c | 0.15b | 0.84c | 0.30b | 0.19c | 0.53a | |
| Boiling | 7.58a | 10.45a | 119.27b | 5.40a | 0.02a | 0.79b | 0.13a | 0.05a | 0.64b | |
| Raw | 7.93a | 14.37d | 160.10d | 6.15b | 0.04a | 0.63a | 0.27b | 0.13b | 0.61b | |
| Agbagba Ripe (Stage 5) | Frying | 10.30c | 21.88e | 268.65f | 6.36b | 0.14b | 0.90d | 0.45c | 0.08a | 0.76c |
| Drying | 10.41c | 23.61f | 264.11e | 6.40b | 0.16b | 0.96d | 0.51c | 0.10b | 0.77c | |
| Boiling | 7.69a | 11.25b | 108.81a | 5.54a | 0.04a | 0.53a | 0.18a | 0.02a | 0.54a | |
| Raw | 7.48a | 12.36c | 140.55c | 5.36a | 0.06a | 0.45a | 0.18a | 0.04a | 0.59a |
Table 3.
Mean value of mineral composition of plantain cultivars (mg/Kg) by ripening and processing methods.
Means followed by different superscript within a column indicate a significant difference (p < 0.05). Ca = calcium, Mg = magnesium, K=Potassium, Na = sodium, Mn = manganese, Fe = iron, Cu = copper, Zn = zinc, Al = Aluminum.
The potassium content of the fruits was significantly influenced by fruit ripeness and the processing method. Still, there was a progressive decrease in potassium levels as ripening progressed across all processing methods studied. Potassium content ranged from 88.23–366.45 mg/Kg for PITA 26, 123.90–528.50 mg/Kg for PITA 27, 90.01–380.65 mg/Kg and 108.81–342.85 mg/Kg for Agbagba respectively. Inyang
Sodium ranged from 5.01–6.39 mg/Kg for PITA 26, 5.48–6.30 mg/Kg for PITA 27, 4.72–6.48 mg/Kg for Mbi Egome and 5.36–7.24 mg/Kg for Agbagba. Fried and dried fruits recorded the highest sodium at all ripening stages. Generally, the amount of sodium for all fruits at different processing methods and ripening stages were low compared to other nutrients like calcium, magnesium, and potassium. The low amount of sodium recorded in fruits makes them suitable for hypertensive patients ([25]).
Manganese, Iron, Zinc and Aluminum content was not significantly influenced by the stage of fruit ripeness and recorded low values across all the processing methods. Iron is a vital nutrient in the body but is relatively more minor in the samples studied. The highest Mn, Fe, Zn and Al concentrations were recorded for dried and fried fruits for all ripening stages. The boiling process significantly (P < 0.05) reduced the fruit Mn, Fe, Zn and Al contents, particularly at the ripe stages. Boiling had been implicated in reducing iron, copper, and zinc in plantain pulp.
The ANOVA results showed that variety had a no significant(P > 0.05) effect on the minerals but a slightly significant (p < 0.05) effect on potassium However, the processing method had a significant (p < 0.001) effect on calcium, magnesium, potassium, and sodium but was not significant for other minerals. The effect of ripening on calcium, magnesium, potassium, manganese and aluminum contents was highly significant (p < 0.001) but had a slightly significant (p < 0.01) effect on iron and copper. Variety x processing method interaction had a slightly significant effect (p < 0.05) for potassium and manganese, but variety x ripening stage interaction had a slight significant effect (p < 0.05) on only potassium. However, it is imperative to note that the processing method x ripening stage interaction had no significant (P > 0.05) effect on all the minerals. The result agrees with banana varieties’ reported results. Thus, the ripening stage is the only factor that showed a pronounced effect on all the minerals, while the processing method primarily affects the macro-elements (calcium, magnesium, potassium). This could be due to the leaching of those minerals into the water used for the processing, and these minerals have been identified as water-soluble.
Further studies should be conducted on the effect of processing methods on quality attributes and nutrient retention of other types of plantain hybrids and valorization of plantain peels used in this study. Other forms of processing methods not used in this study should be applied for further studies.
Advertisement
4. Conclusion
Generally, the plantain cultivars showed high moisture, carbohydrate and starch content but lower fat, ash, protein and sugar content. The unripe stage showed high ash, protein, carbohydrate and starch content but low moisture content, while the ripe stage showed high moisture, fat, and sugar content. At the unripe ripening stage, plantain showed the most increased potassium, magnesium, calcium, sodium, manganese, and iron mineral content over the ripe stage. Processing at the unripe stage is the best option to obtain the maximum nutrients in plantain fruits. Also,
Moreover, the frying method maintained high ash, fat, carbohydrate, protein, sugar and starch content than other processing methods. Fried and dried fruits at the unripe stage kept high potassium, magnesium, calcium, manganese and low sodium mineral content over other processing methods; therefore, it stands as the best ripening stage.
Advertisement
Acknowledgments
The authors acknowledge the support received from the CGIAR Research Program on Roots, Tubers and Bananas (RTB), the staff of the Food and Nutrition Science Laboratory and the Plantain and Banana Breeding Unit of the International Institute of Tropical Agriculture (IITA), Ibadan, Nigeria, and Department of Food Technology of the University of Ibadan, Nigeria.
Advertisement
Funding details
This research received no specific grant from the public, commercial, or not-for-profit funding agencies.
Advertisement
Declaration of interest statement
The authors report there is no competing interest to declare.
Advertisement
CREDIT Author statement
Oluchukwu Anajekwu was responsible for conceptualization, investigation, data curation, and writing original draft preparation. Emmanuel Alamu was responsible for resources, visualization, validation, writing the original manuscript, and writing, reviewing, and editing. Rahman Akinoso was accountable for supervising, methodology, investigation, writing, reviewing, and editing. Wasiu Awoyale was responsible for visualization, data curation, software, writing, reviewing, and editing. Delphine Amah was responsible for Resources, writing, reviewing and editing. Busie Maziya-Dixon was accountable for conceptualization, methodology, investigation, resources, supervision, writing, reviewing, and editing.
Advertisement
Limitation of the study
As a climacteric fruit, plantains (
References
- 1.
Adenitan A, Awoyale W, Akinwande AB, Maziya-Dixon B. Influence of drying methods on heavy metal composition and microbial load of plantain chips. Cogent Food and Agriculture. 2022; 8 :1-22 - 2.
Anajekwu EO, Maziya-Dixon B, Akinoso R, Awoyale W, Alamu EO. Physicochemical properties and total carotenoid content of high-quality unripe plantain flour from varieties of hybrid plantain cultivars. Journal of Chemistry. 2020; 2020 :1-7 - 3.
Ogechi UP, Akhakhia OI, Ugwunna UA. Nutritional status and energy intake of adolescents in Umuahia urban, Nigeria. Pakistan Journal of Nutrition, Vol. 2017; 6 (6):641-646 - 4.
Akinsanmi AO, Oboh G, Akinyemi JA, Adefegha AS. Assessment of the nutritional, anti-nutritional, and antioxidant capacity of unripe, ripe, and overripe plantain ( Musa paradisiaca ) peels. International Journal of Advanced Research. 2015;3 (2):63-72 - 5.
Ubi GM, Nwagu KE, Jemide JO, Egu CJ, Onabe MB, Essien IS. Organoleptic and horticultural characterization of selected elite cultivars of plantain ( Musa paradisiaca L .) for value addition and food security in Nigeria. Journal of Advances in Biology and Biotechnology. 2016;6 (4):1-19 - 6.
Amah D, Stuart E, Mignouna D, Swennen R, Teeken B. End-user preferences for plantain food products in Nigeria and implications for genetic improvement. International Journal of Food Science and Technology. 2021; 56 (3):1148-1159 - 7.
Ayodele OD, Fagbenro I, Adeyeye A. The effect of processing method on the proximate, anti-nutrient and phytochemical composition of ripe and unripe plantain ( Musa paradisiaca ). Open Science Journal of Analytical Chemistry. 2019;4 :1-6 - 8.
Singh JP, Kaur A, Shevkani K, Singh N. Influence of jambolan ( Syzgium cumini ) and xanthan gum incorporation on the physicochemical, antioxidant and sensory properties of gluten-free eggless rice muffins. International Journal of Food Science and Technology. 2015;50 :1190-1197 - 9.
Balwinder S, Jatinder PS, Amritpal K, Narpinder S. Bioactive compounds in banana and their associated health benefits – A review. Food Chemistry. 2016; 206 :1-11 - 10.
Bhuiyan F, Campos NA, Swennen R, Carpentier S. Characterizing fruit ripening in plantain and Cavendish bananas: A proteomics approach. Journal of Proteomics. 2020; 214 :1-11 - 11.
Adeyanju JA, Olajide JO, Adedeji AA. Optimisation of deep-fat frying of plantain chips (Ipekere) using response surface methodology. Journal of Food Processing and Technology. 2016; 7 :1-6 - 12.
Ajiboye AO, Shodehinde SA. Diet supplemented with boiled unripe plantain ( Musa paradisiaca ) exhibited antidiabetic potentials in streptozotocin-induced Wistar rat. Journal of Food Biochemistry. 2022;46 :1-9 - 13.
AOAC. Official Method of Analysis. Washington DC: Association of the Analytical Chemist; 2005 - 14.
AACC, American Association of Cereal Chemists. Approved Methods of the AACC, Methods. 10th ed. St. Paul, MN, USA: Cereals & Grains Association. 2005 - 15.
Amoros W, Salas E, Hualla V, Burgos G, De Boeck B, Eyzaguirre R, et al. Heritability and genetic gains for iron and zinc concentration in diploid potato. Crop Science. 2020; 60 :1884-1896 - 16.
SAS. Statistical Analysis Software (SAS), Qualification Tools User’s Guide SAS 9.2. Cary, NC, USA: SAS Institute Inc.; 2008 - 17.
Fadimu JF, Sanni LO, Adebowale AA, Kareem S, Sobukola PO, Kajihausa O, et al. Effect of drying methods on the chemical composition, color, functional and pasting properties of plantain ( Musa parasidiaca ) flour. Croatian Journal of Food Technology, Biotechnology and Nutrition. 2018;13 (1–2):38-43 - 18.
Mba OG, Dumont MJ, Ngadi M. Influence of palm oil, canola oil and blends on characteristics of fried plantain crisps. British Food Journal. 2015; 117 (6):1793-1807 - 19.
Okole PA, Isirima CB, Ogunu-Ebiye UG, Chijioke-Eke JN. Proximate and mineral composition of plantain ( Musa paradisiaca ) flour obtained through different processing methods. Nigerian Agricultural Journal. 2022;53 (1):137-142 - 20.
Okareh OT, Adeolu AT, Adepoju OT. Proximate and mineral composition of plantain ( Musa paradisiaca ) wastes flour: A potential nutrients sources in the formulation of animal feeds. African Journal of Food Science and Technology. 2015;6 (2):53-57 - 21.
Omotosho OE, Garuba R, Ayoade F, Adebayo AH, Adedipe OE, Chinedu SO. Effect of deep fat drying using canola oil, soya oil and vegetable oil on the proximate, vitamins and mineral contents of unripe plantain ( Musa paradisiacal ). Journal of Applied Science. 2016;16 (3):103-107 - 22.
Alamu EO, Ntawuruhunga P, Chileshe P, Olaniyan B, Mukuka I, Maziya-Dixon B. Nutritional quality of fritters produced from fresh cassava roots high-quality cassava and soy flour blends and consumer preferences. Cogent Food & Agriculture. 2019; 5 :1677129 - 23.
Yarkwan B, Uvir RH. Effects of drying methods on the nutritional composition of unripe plantain flour. Food Science and Quality Management. 2015; 41 :5-10 - 24.
Ekesa B, Nabuuma D, Blomme G, Bergh I. Provitamin A carotenoid content of unripe and ripe banana cultivars for potential adoption in eastern Africa. Journal of Food Composition and Analysis. 2015; 43 :1-6 - 25.
Sojinu OS, Biliaminu NT, Mosaku AM, Makinde KO, Adeniji TH, Adeboye BM. The implication of ripening agents on chemical composition of plantain ( Musa paradisiaca ). Heliyon. 2021;7 :1-5 - 26.
Inyang UE, Nkop SE, Umoh EB. Effect of the stage of ripening on the nutrients, anti-nutrients and functional properties of flours made from whole plantain fruit. Current Journal of Applied Science and Technology. 2017; 24 (1):1-9